Workshop Overview
Dataparity Inc. is a fictional financial services firm assessing sensitive data across SaaS, endpoints, and AI tools. Alex explores existing findings and builds detection and enforcement policies, Kevin tests web, endpoint, and preconfigured browser controls, and Priya reviews existing incidents and response workflows. The company and personas connect these complementary exercises, not a single file or incident. Allow approximately four hours, including introductions, discussion, breaks, and setup.
Learning Path
Module Overview
Meet the Team
Dataparity's security admin. Alex reviews SaaS and endpoint findings in Module 1, then builds detection logic and web/endpoint policies in Labs 5–7. Browser policies in Lab 8 are preconfigured.
A busy employee testing convenient tools. Kevin tries a web upload, local file access and clipboard paste, then browser masking, sensitive-download blocking, and watermarking.
Dataparity's SOC analyst. Priya reviews a pre-populated incident queue, evidence, existing notifications and state changes, available actions, and workflow previews — without changing records.
Labs 6 and 7 reuse Dataparity_Q2_2025_Workforce_Financial_Summary.docx and the Lab 5 detection engine. Lab 8 uses supplied customer text, a sensitive sample PDF from DLP Test, and a browser-viewed document with preconfigured controls. Labs 3, 4, and 9 explore independent pre-populated records — not the student's file or incident.
Lab Tenants
Pre-populated with production-like data for read-only exploration. Sign in using CloudShare → Credentials → SDC Credentials for Modules 1 and 3. No configuration or incident-response actions are performed.
Use CloudShare → Credentials → Zscaler Tenant / Student Admin for Module 2. Build detection and web/endpoint policies in Labs 5–7; Lab 8 uses preconfigured browser controls and its separate extension login. Allow 15 minutes for Module 2 prerequisites, including VM/Client Connector setup and SSL inspection verification.
Module 1 Overview
Enterprise Tenant (Read-Only)
You are logged into Tenant 1 — a pre-populated environment with realistic production-like data. No policies will be created or modified in this module. You are here to observe and assess.
Before enforcing policies, Alex explores Dataparity's SaaS usage, corporate and personal instances, endpoint data and activity, and Microsoft 365 sharing exposure. Lab 3 connects sensitive-file findings with a user's timeline, endpoint applications, and connected-device inventory. These are pre-populated observations, not incidents generated by the student's later tests.
Module Objectives
| Question | Capability |
|---|---|
| Which unsanctioned apps are employees using? | Shadow IT Discovery |
| Are employees mixing corporate and personal accounts? | Instance Discovery |
| What sensitive data is flowing through SaaS apps? | Auto Discovery |
| How exposed is Dataparity's SaaS security posture? | SaaS Security Posture Management (SSPM) |
| What third-party apps have OAuth access to corporate data? | App Governance |
| What sensitive data is sitting at rest on managed endpoints? | Endpoint Data Scan & User Data at Rest |
| What do a user's recorded activities reveal? | User Investigation Overview & Timeline |
| Which endpoint applications and versions warrant investigation? | Application Investigation & Inventory |
| Which devices have been associated with users and endpoints? | Removable Storage & Other Device Inventory |
| What could Microsoft Copilot expose through existing sharing permissions? | Copilot Readiness Assessment |
Labs in This Module
Lab 1 — Visibility into Shadow IT and SaaS Usage
Log Into the Enterprise Tenant
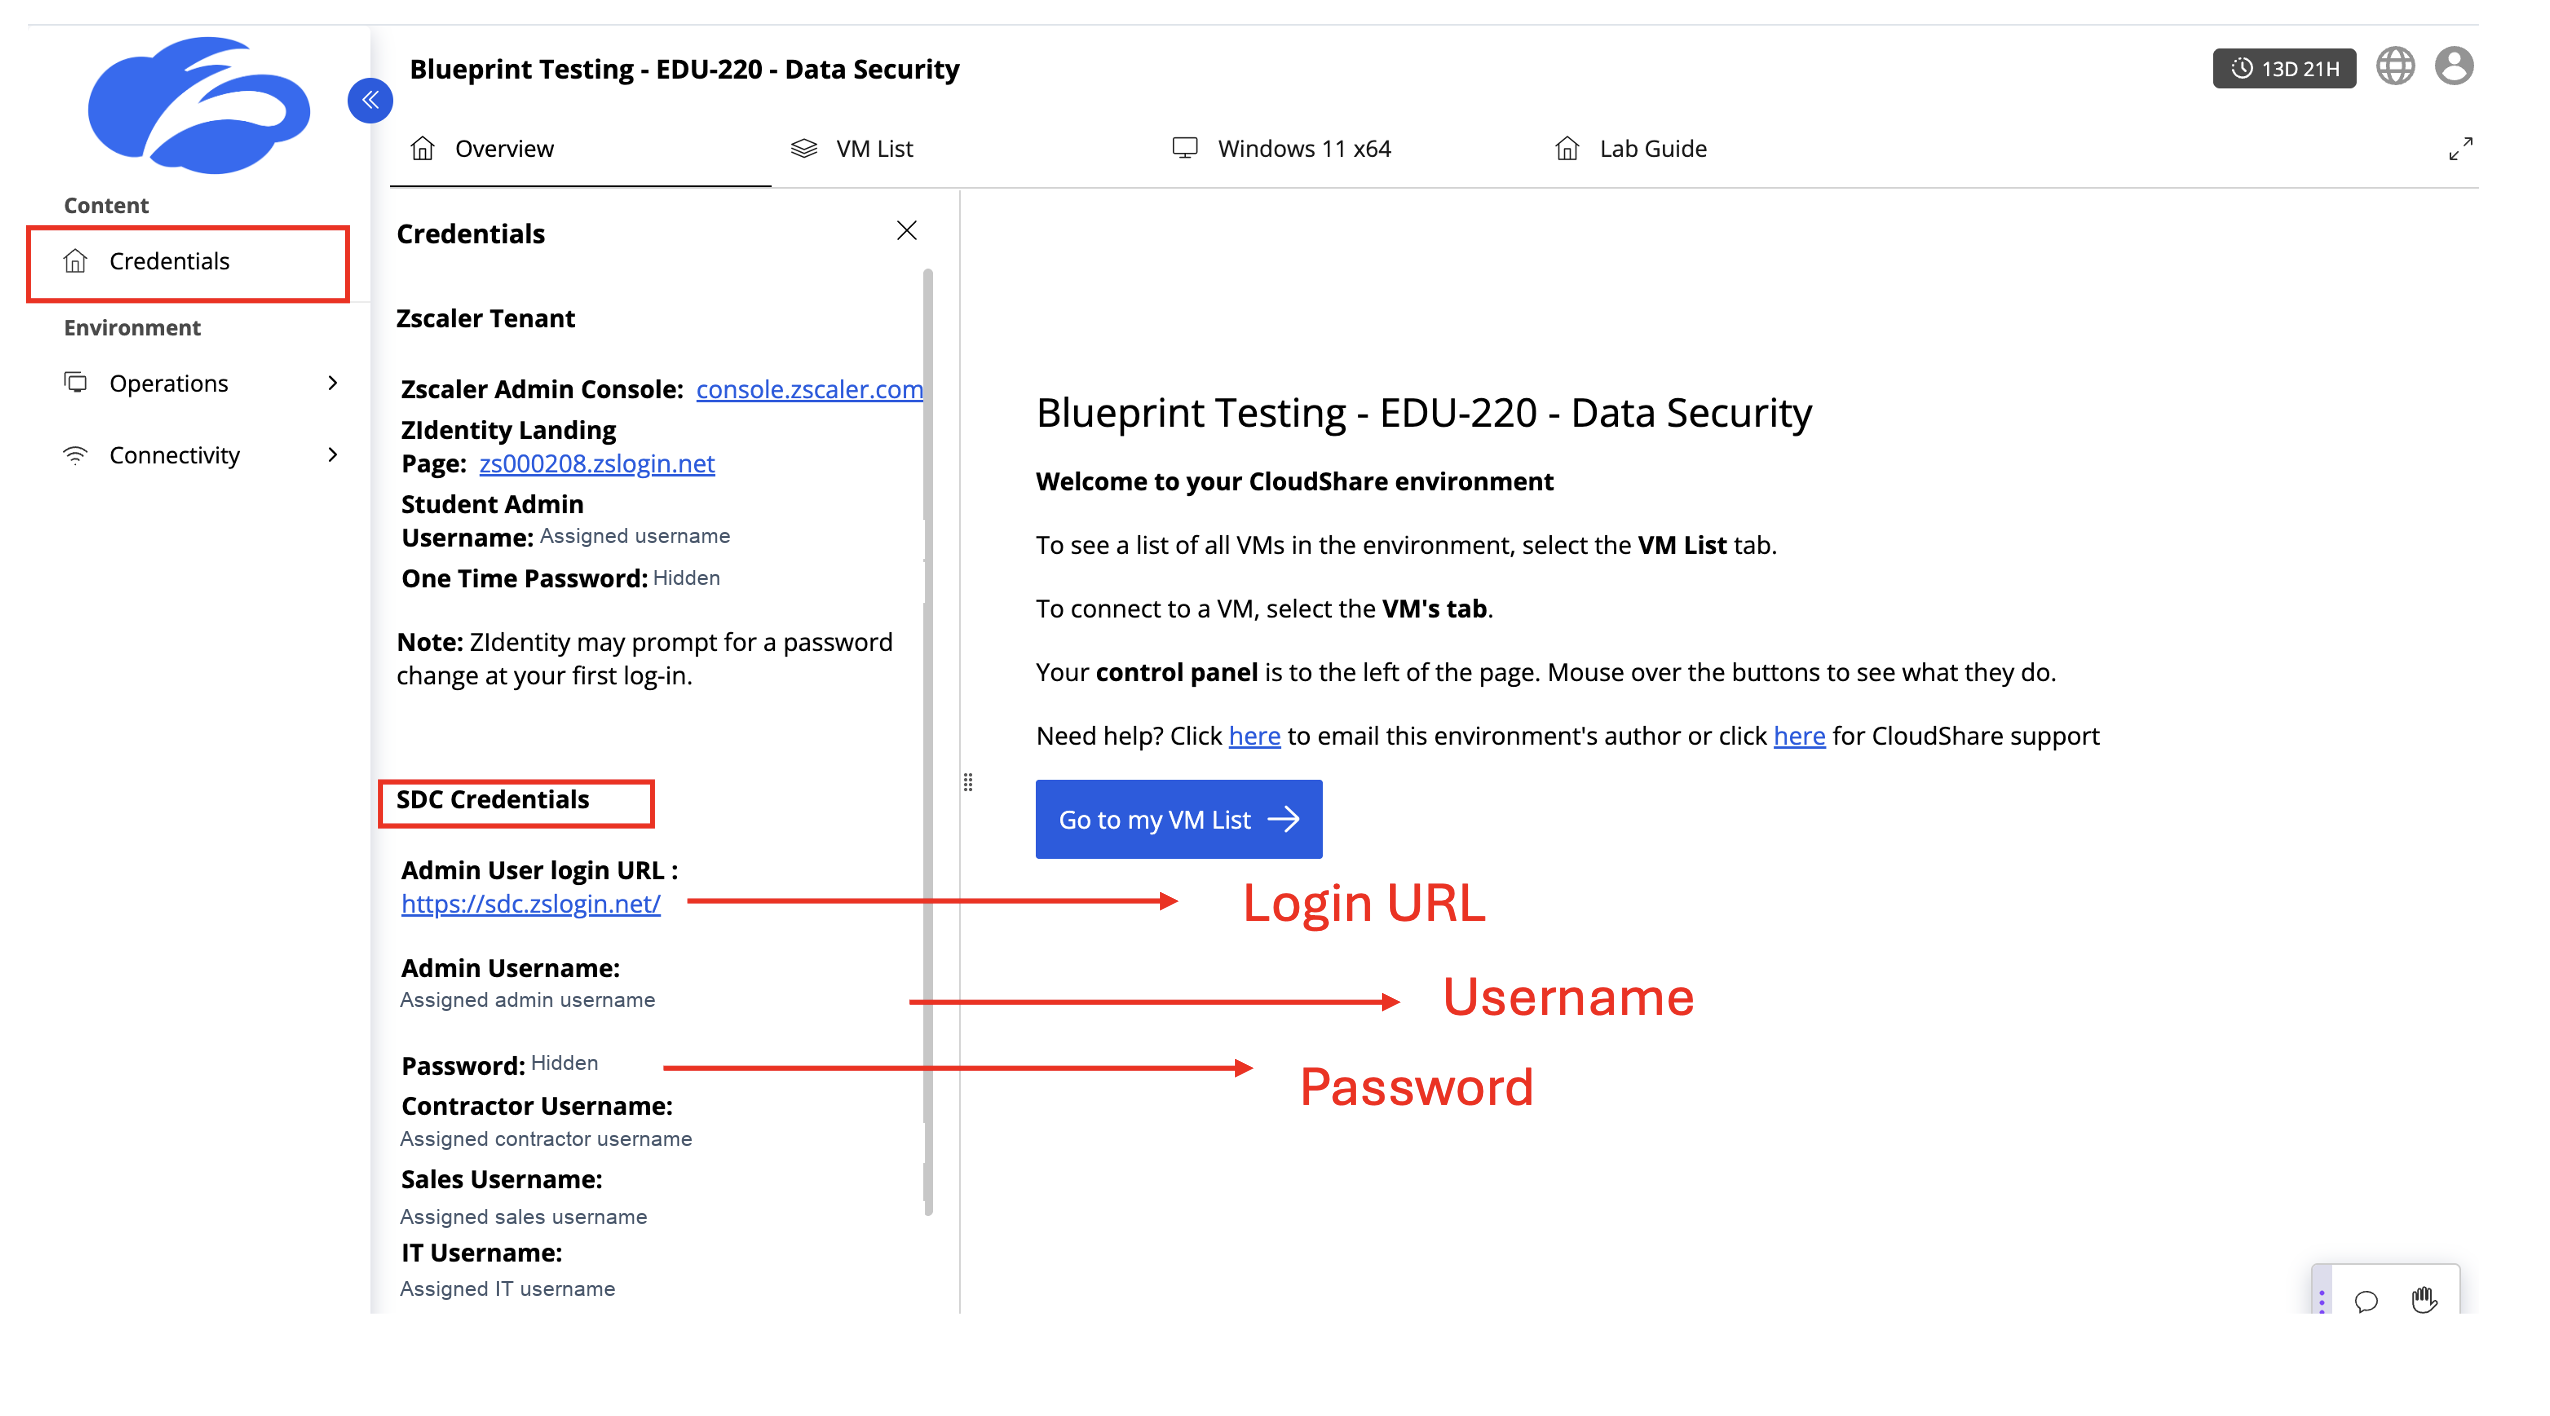
- Open your assigned CloudShare environment and select Credentials in the left menu.
- Scroll to SDC Credentials. Locate the Admin User login URL, Admin Username, and Password.
- Open sdc.zslogin.net in your browser and sign in to the Solution Demo Centre using those SDC Admin credentials.
Use the SDC Credentials section, not the Zscaler Tenant / Student Admin credentials above it.
Use Experience Center Nav 1.0
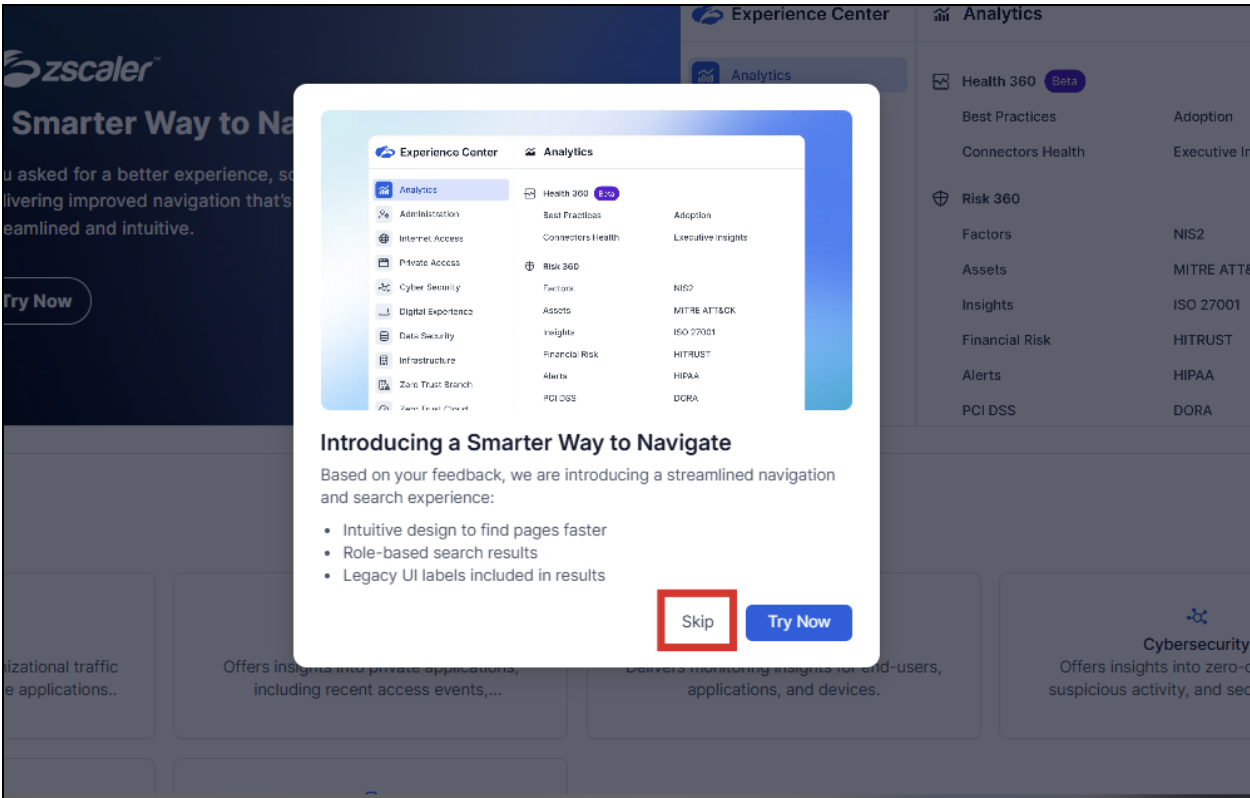
After logging in to your assigned Zscaler Lab tenant / Solutions Demo Center tenant, you should be presented with the Experience Center Nav 1.0 user interface.
Skip the pop-up to try the new navigation.
Task 1: Discover Shadow IT using the SaaS Security Report
Identify unsanctioned cloud applications and understand their potential risk to the organization.
Analytics → Experience Center
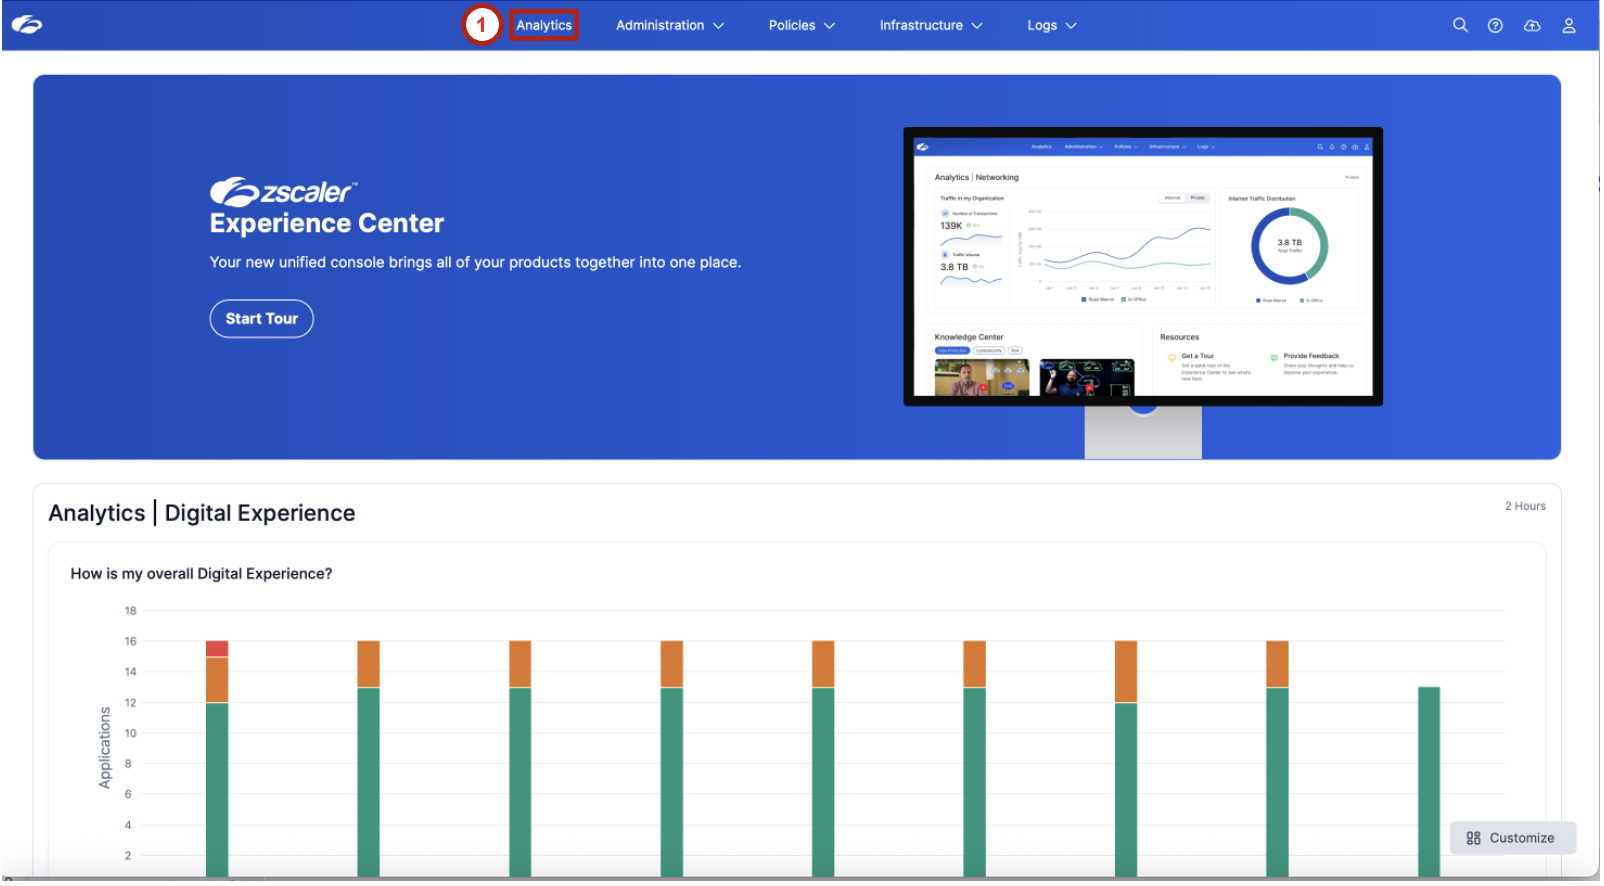
The Experience Center aggregates data from multiple security services to provide a unified visibility platform.
Locate the Switch to Existing Reports toggle in the lower-left corner and ensure it is enabled.
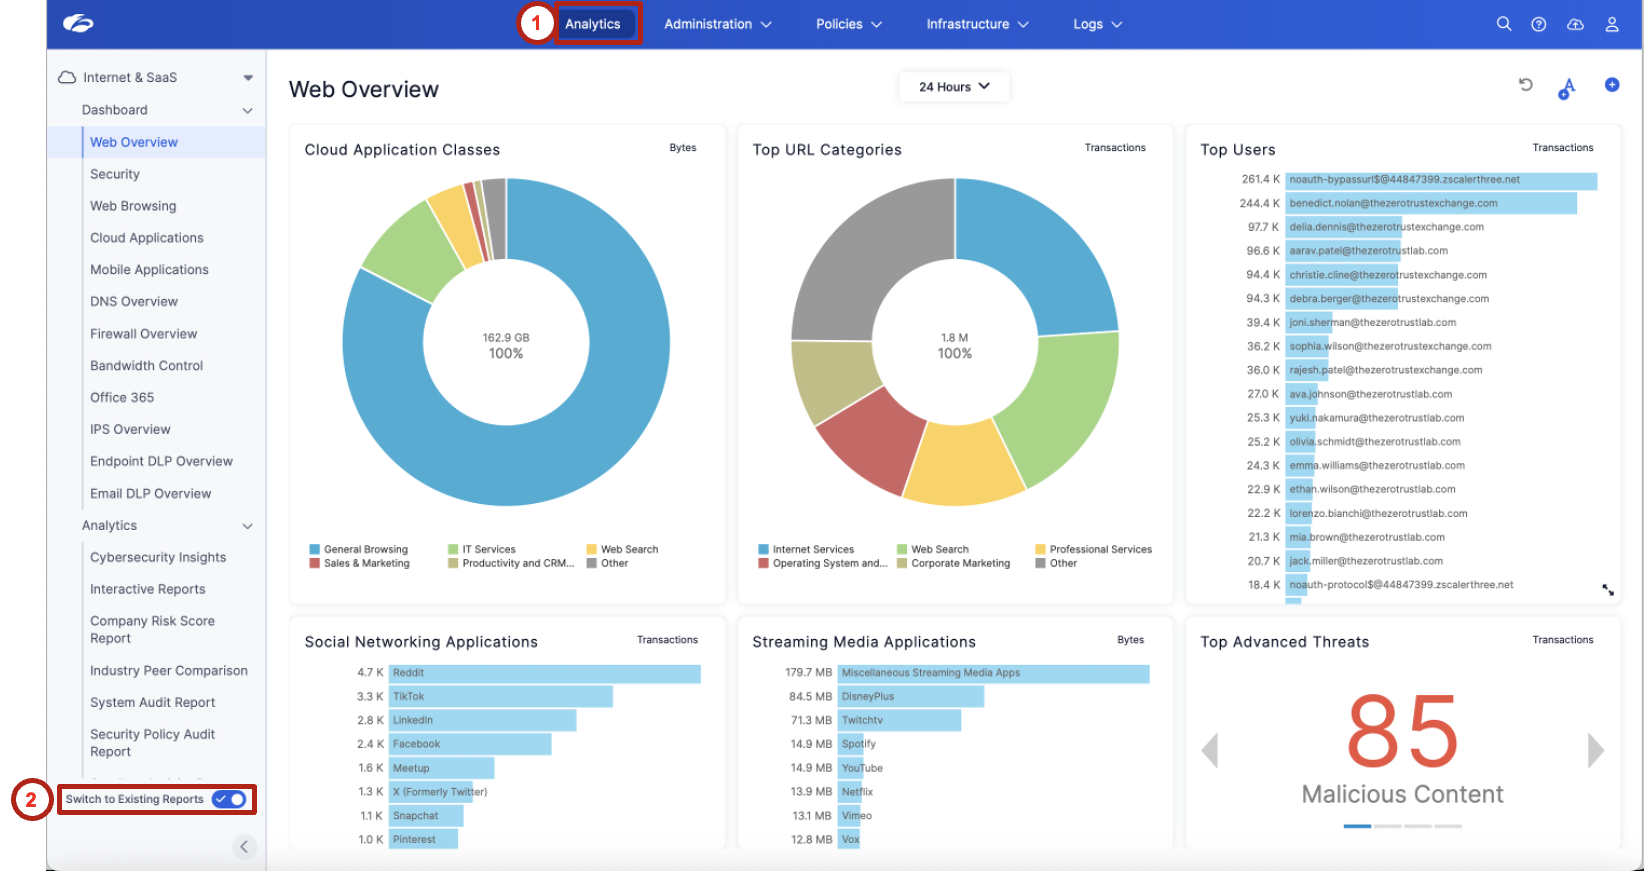
Analytics → SaaS Security Report
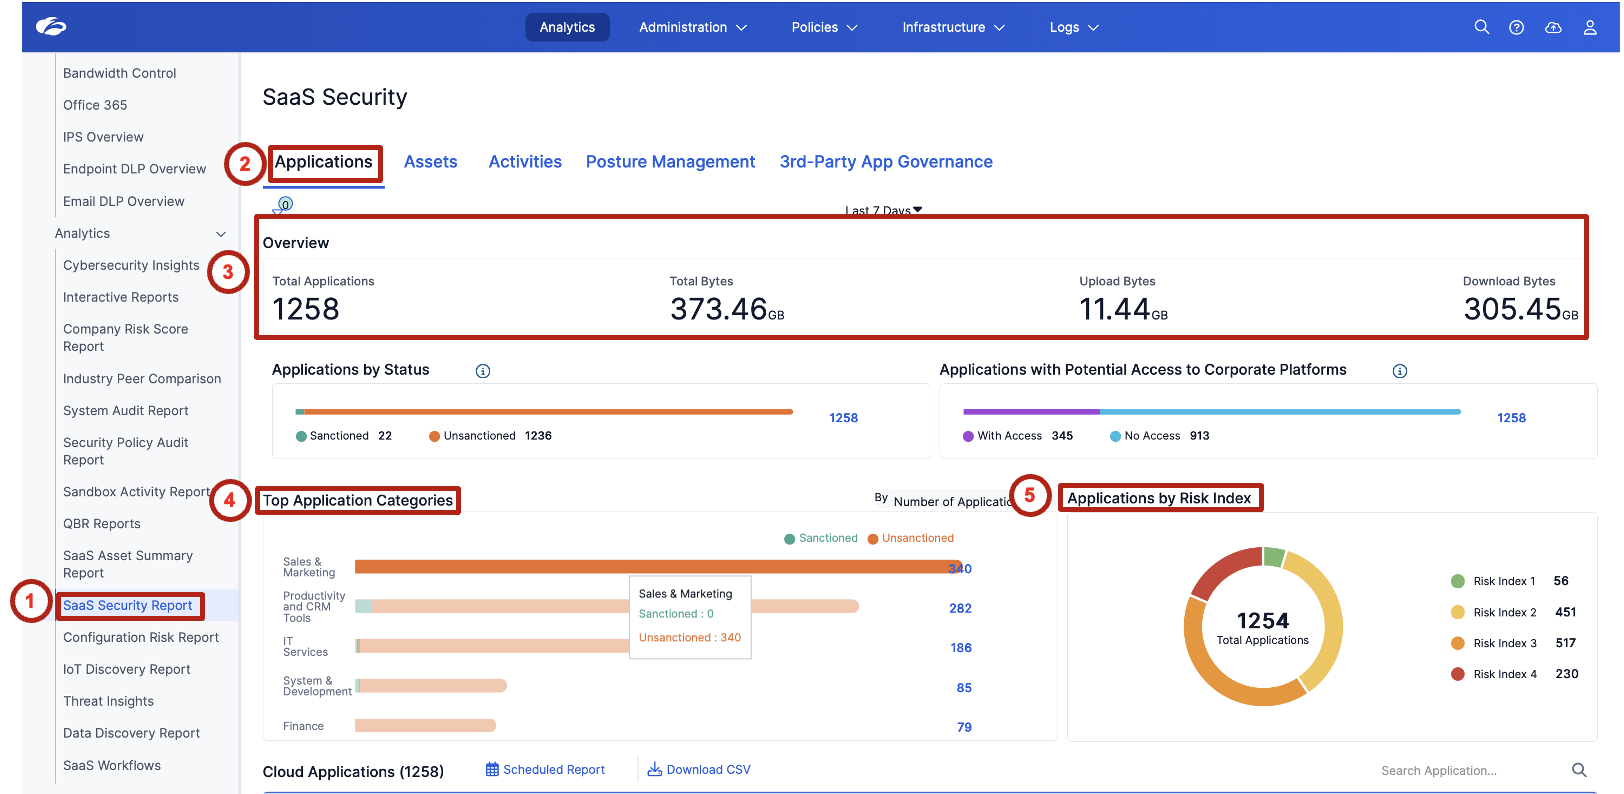
Observe the following metrics in the Overview section, then review Top Application Categories and Applications by Risk Index:
| Metric | What it tells you |
|---|---|
| Total Applications | Number of unique SaaS applications detected |
| Total Bytes | Total volume of data transferred |
| Upload Bytes | Data leaving the organization |
| Download Bytes | Data entering the organization |
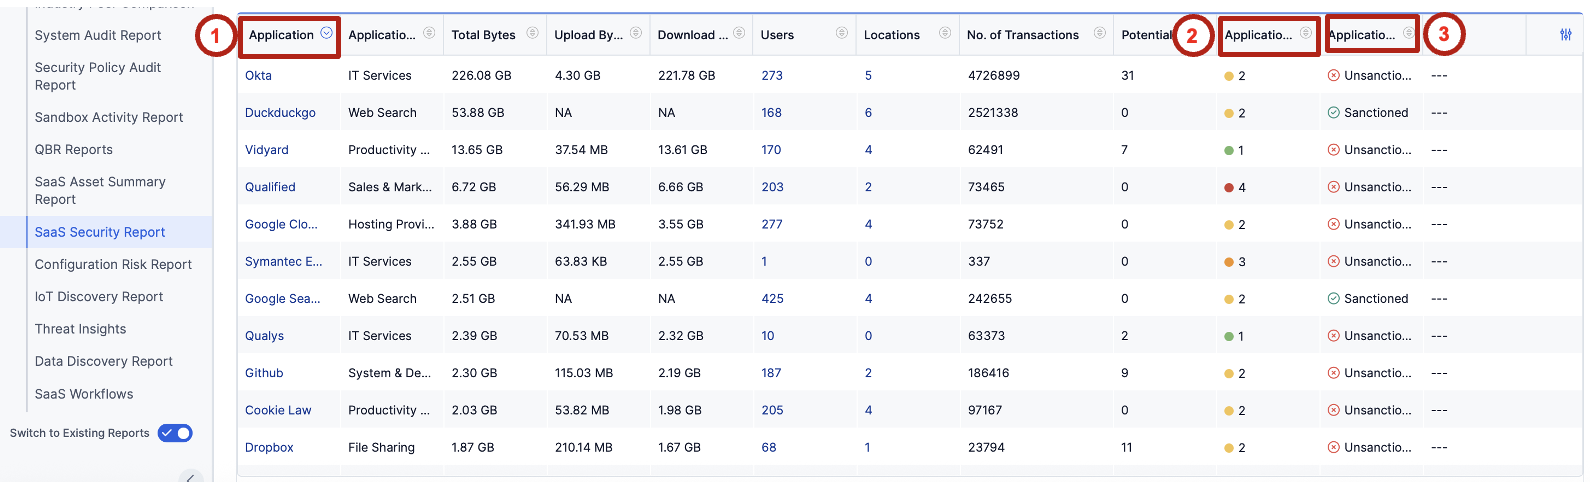
Risk Index scoring helps prioritize investigation and remediation efforts based on potential security impact. Focus on high-risk unsanctioned apps with upload capability first.
Locate an application marked as Unsanctioned — for example, Dropbox — and click the application name to view detailed risk information.
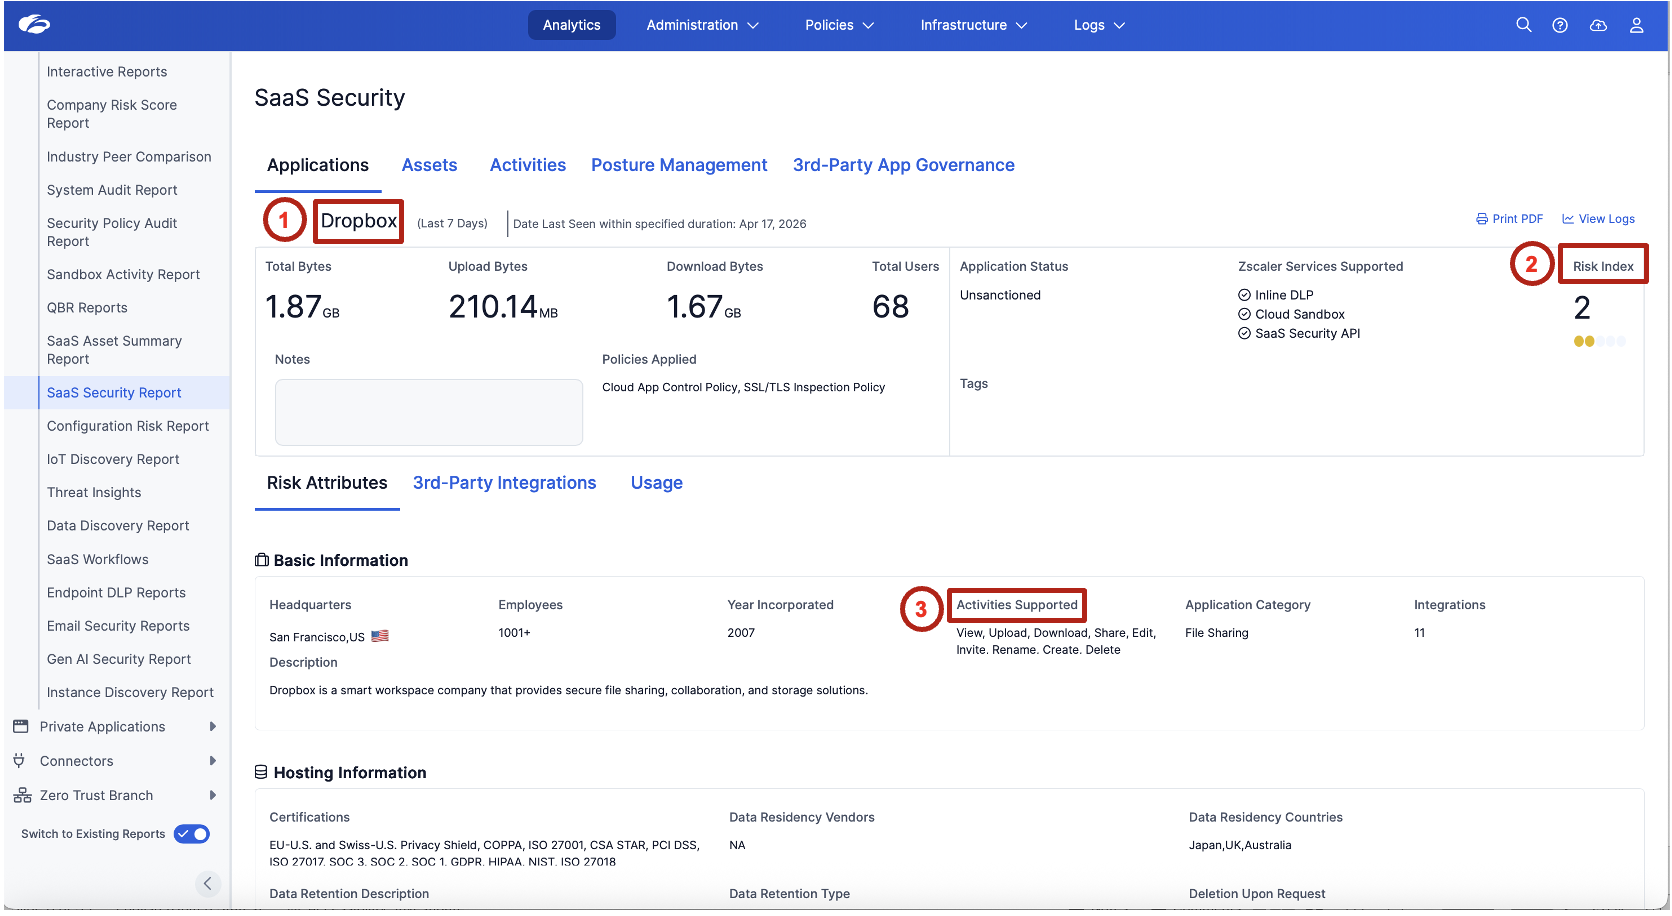
Review the application risk details:
- Application Status — Sanctioned or unsanctioned
- Risk Index — Relative risk level
- Activities Supported — Upload, Download, Share, Edit, Delete
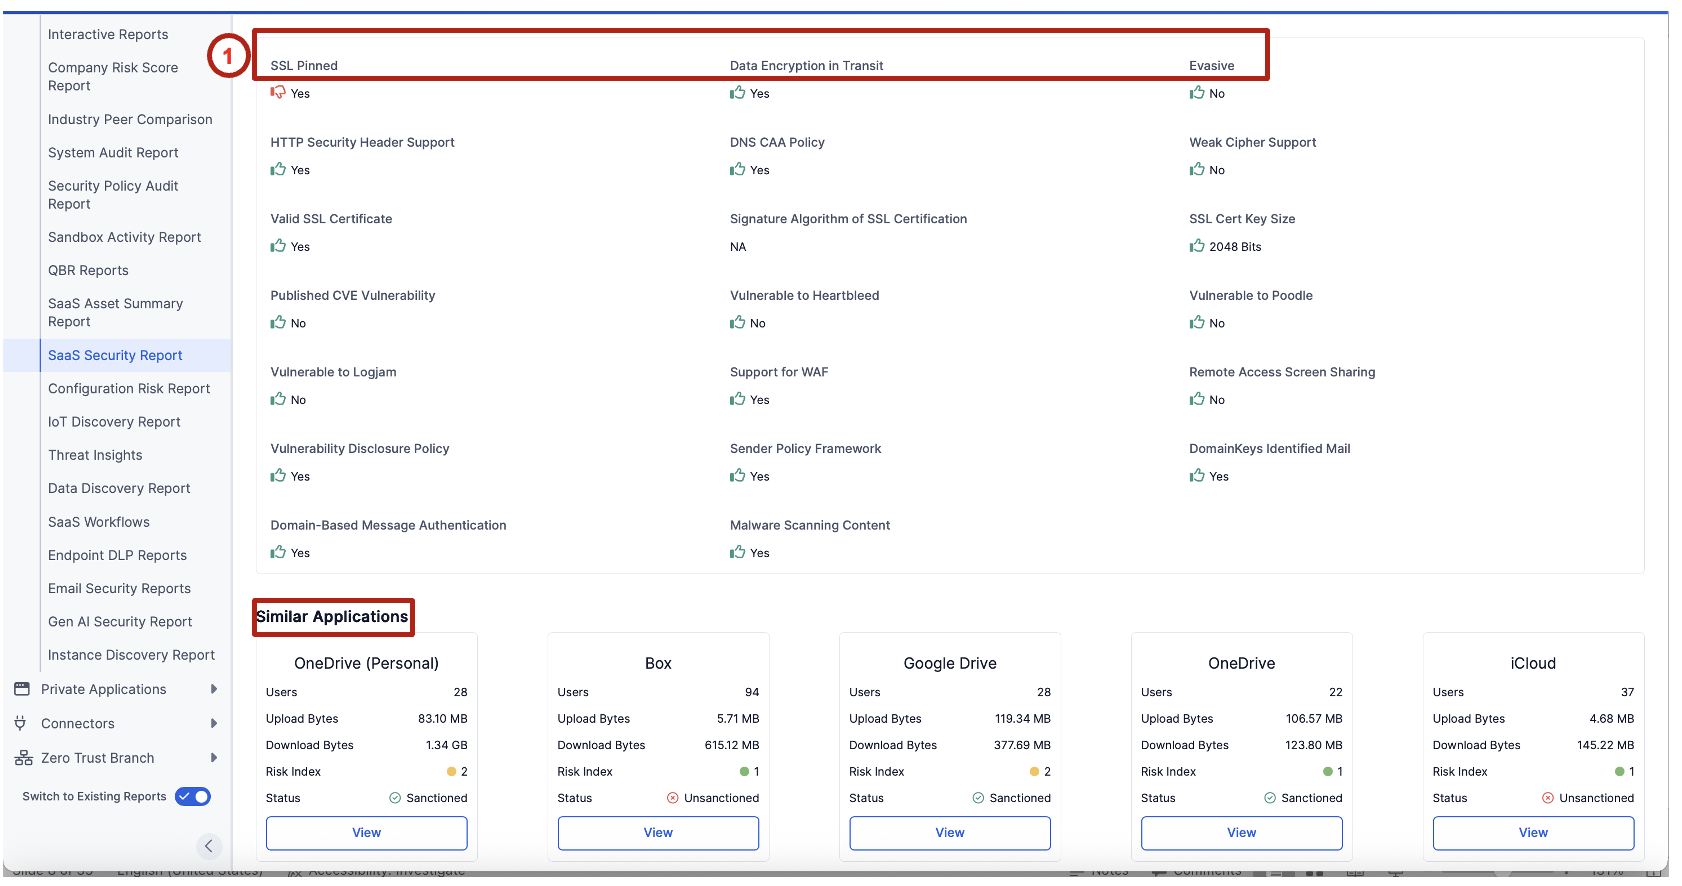
- How many unsanctioned applications exist in the environment?
- Which application categories present the highest risk?
- What types of data could be exposed through unsanctioned file-sharing applications?
- Should all unsanctioned applications be blocked, or should risk-based prioritization be applied?
You cannot protect what you cannot see. Shadow IT discovery provides the visibility required to identify potential data exfiltration vectors before applying security controls.
Task 2: Discover Application Instances
Identify individual SaaS application instances (domains) and understand which users are accessing them.
Analytics → Instance Discovery Report
Select the desired time range (for example, Last Quarter) and choose an application such as Gmail to review detected instances.
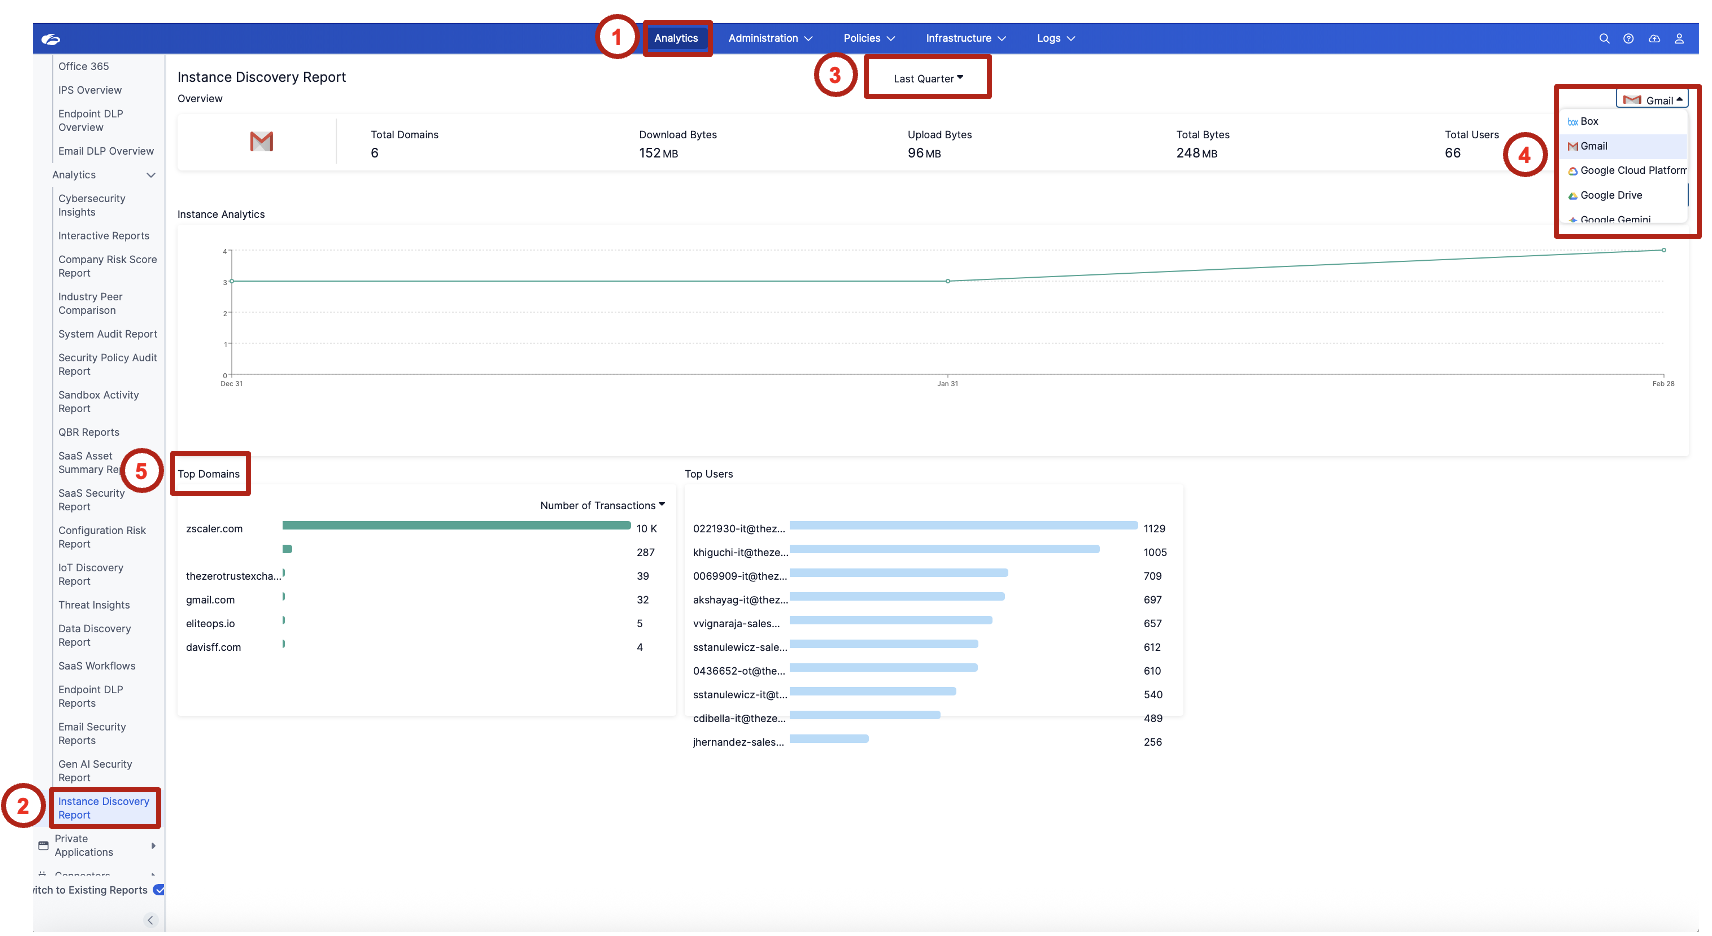
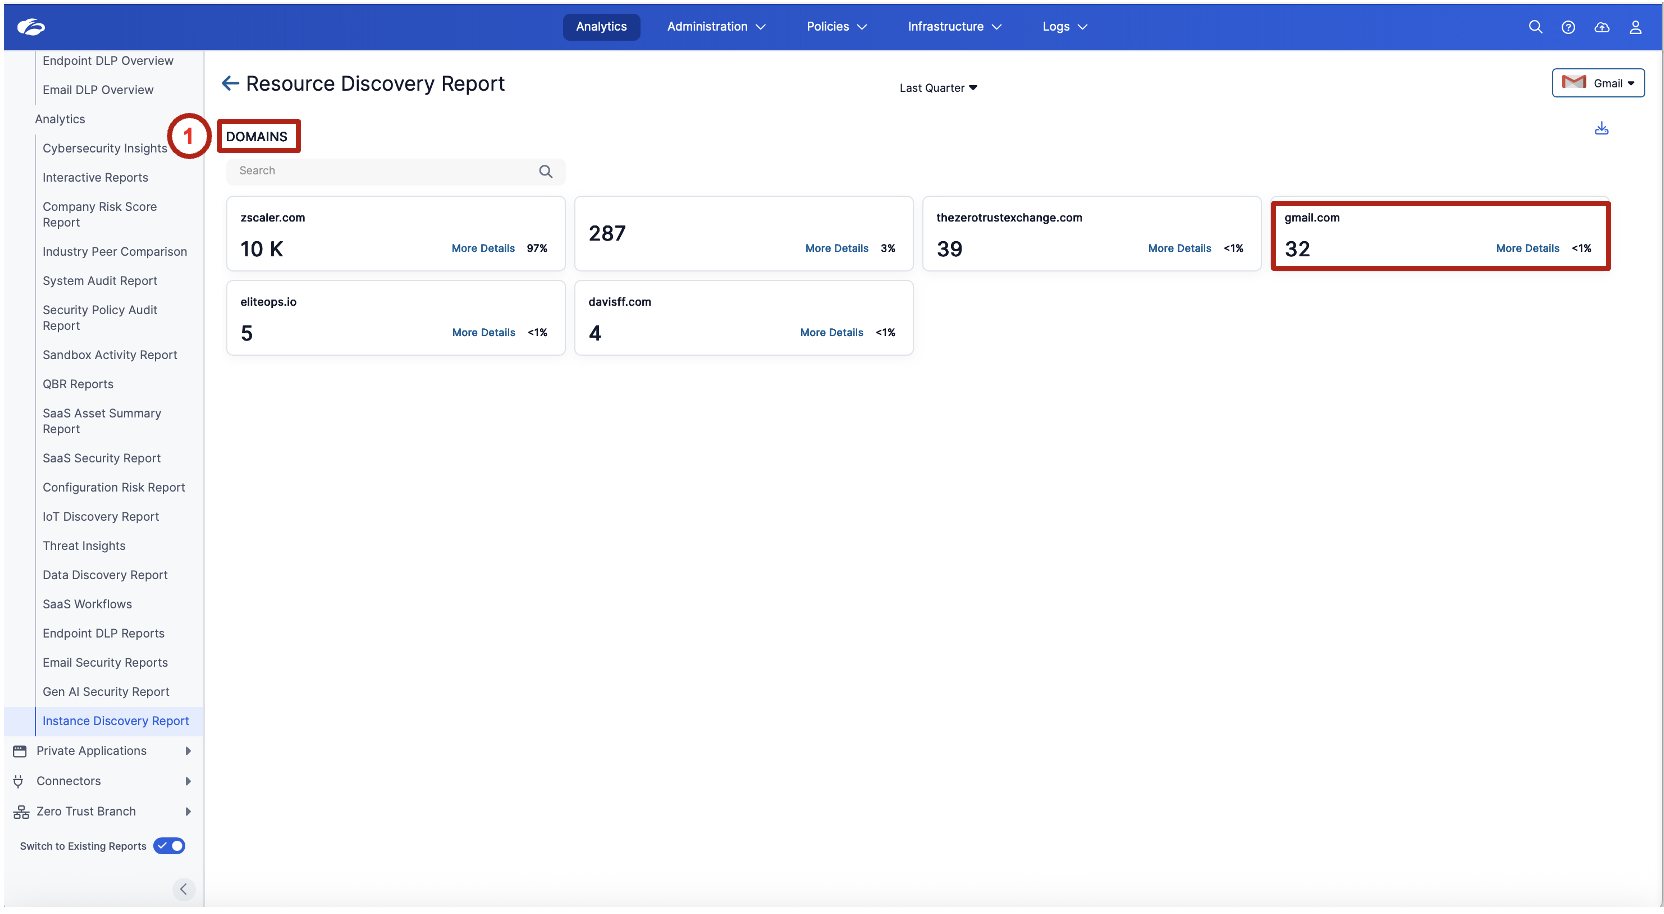
Review the list of detected domains associated with the selected application. Click a domain such as gmail.com to investigate usage details. Then click the Analyze More button to drill deeper into the domain activity.
Observe the list of users interacting with the selected domain and review their activity:
- Upload Bytes
- Download Bytes
- Number of Transactions
- Last Accessed
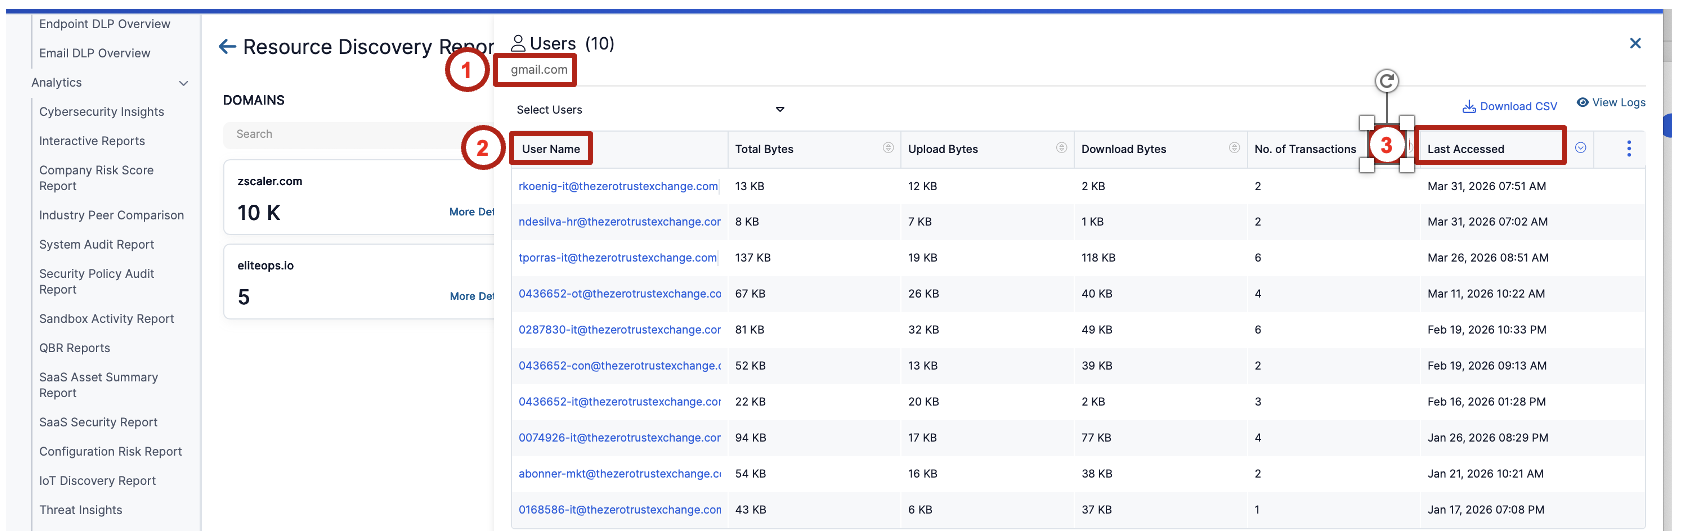
Instance-level visibility goes beyond just knowing which apps are in use — it reveals whether employees are using corporate-managed instances or personal accounts, which have entirely different risk and compliance implications.
Task 3: Automatic Content Classification Using ML-Based Detection
Observe how sensitive content is automatically classified using machine learning, even when no policy is configured.
Analytics → Data Discovery Report
Ensure Switch to Existing Reports is enabled. Review the dashboard showing detected sensitive files and ML categories.
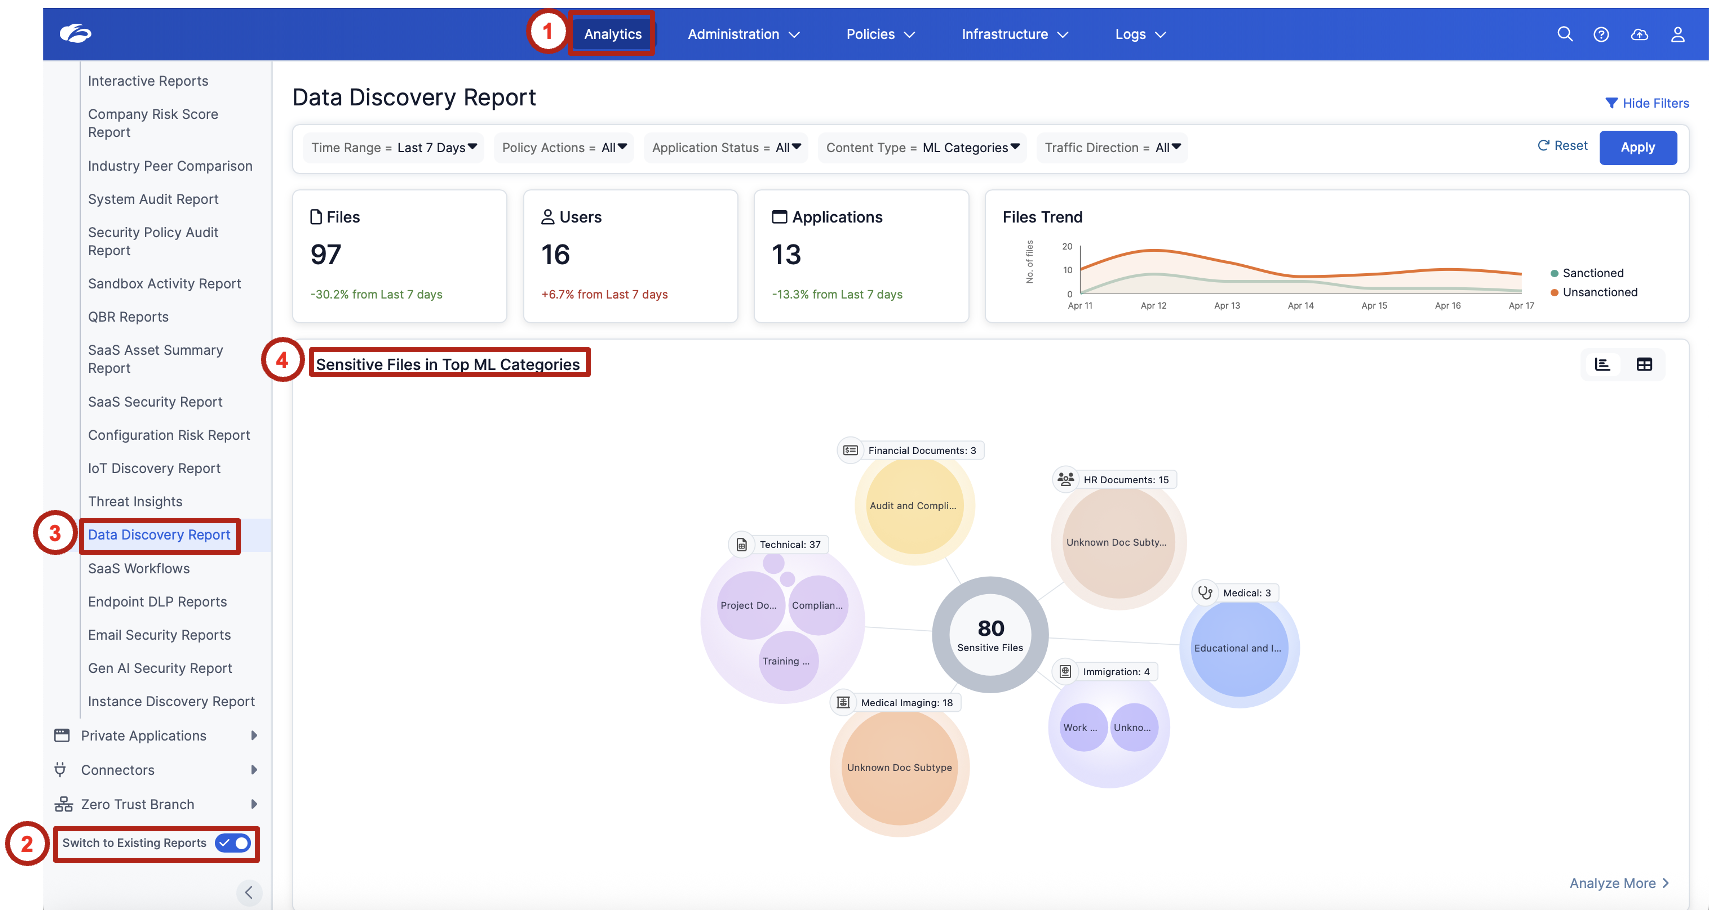
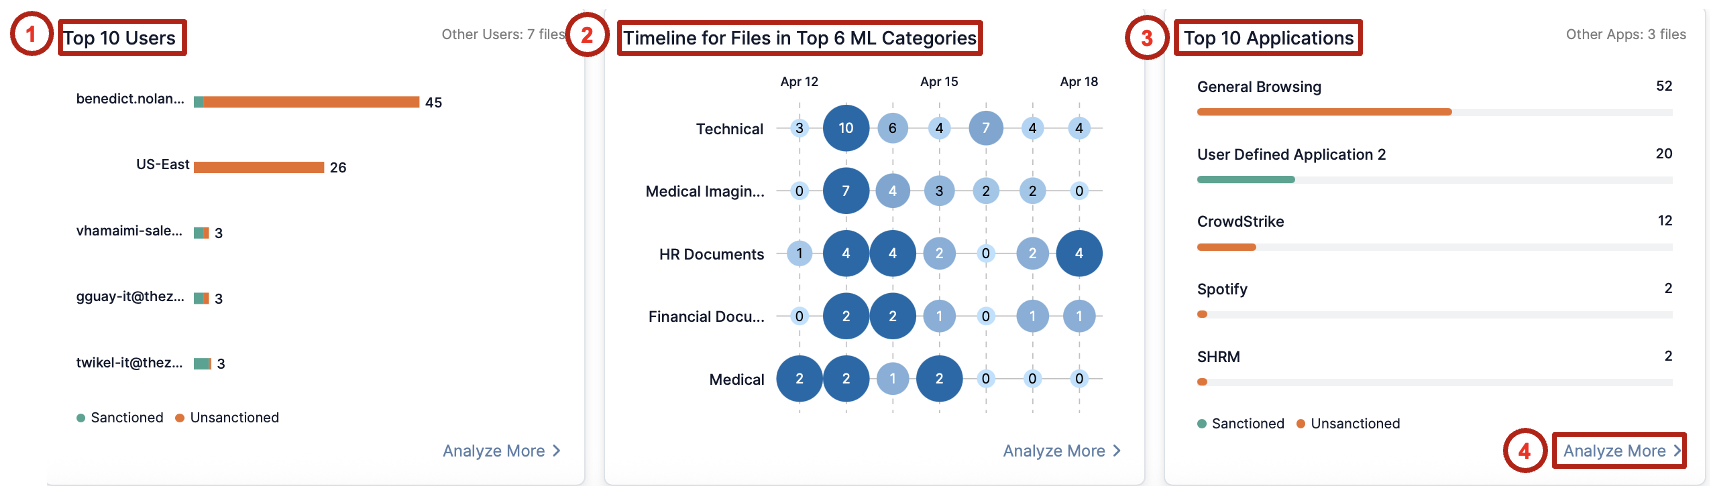
Review the dashboard widgets — Top 10 Users, Timeline for Files in Top ML Categories, Top 10 Applications — and click Analyze More to investigate further.
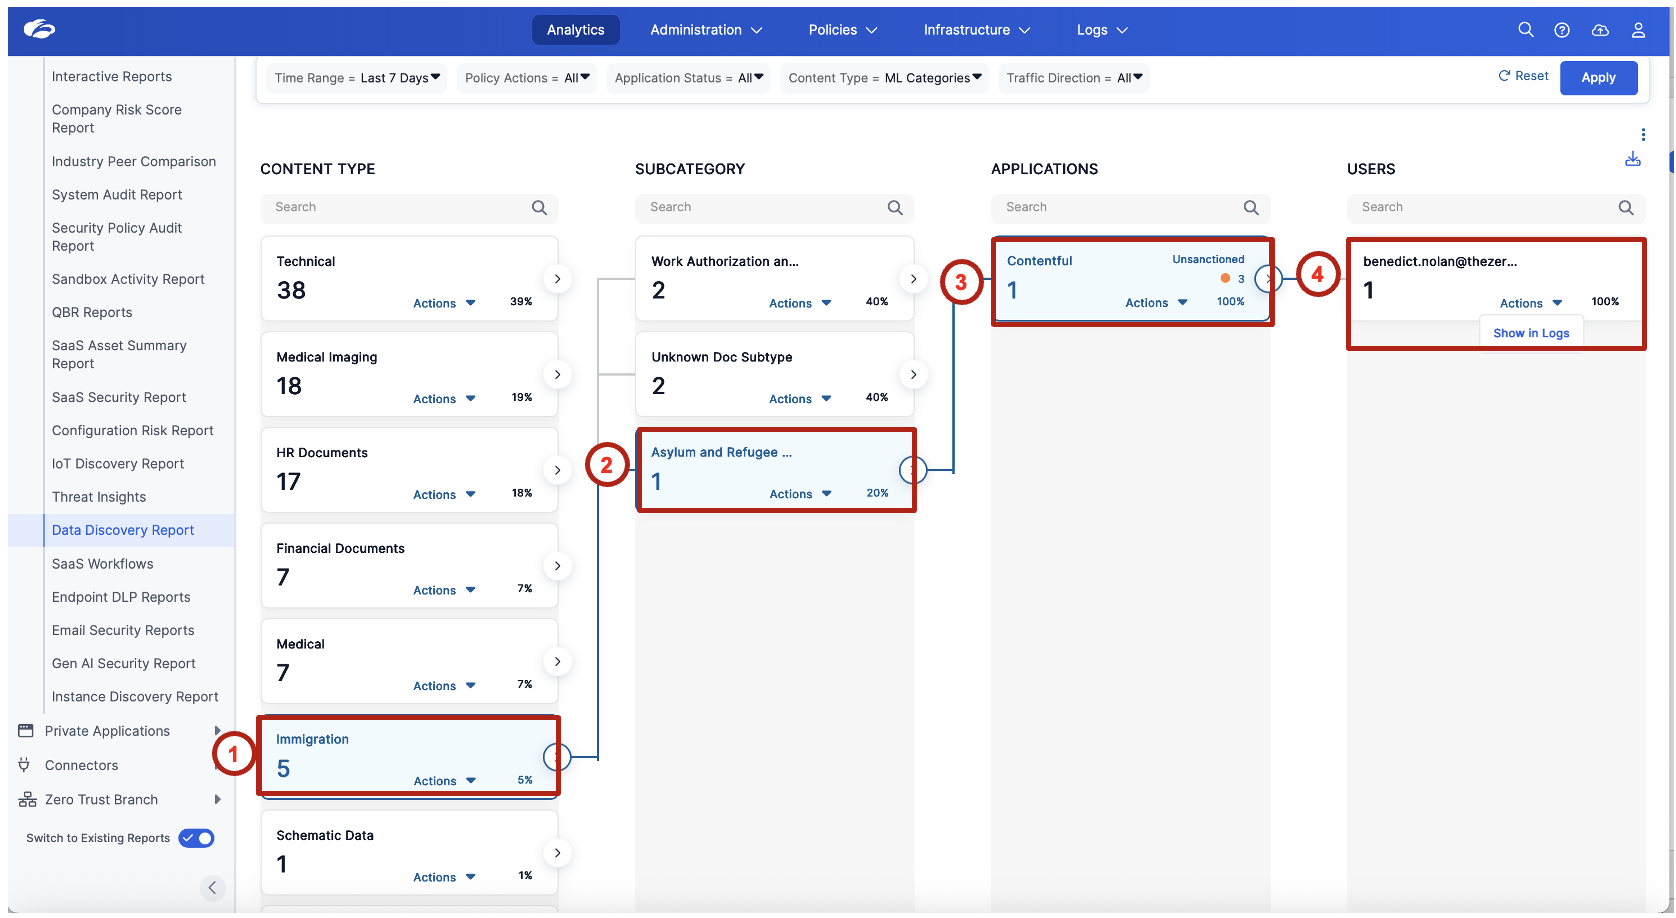
Select a Content Type such as Immigration and a Subcategory such as Asylum and Refugee. Review the associated Application and User.
- Which ML content categories appear most frequently in your environment?
- Does seeing user-level attribution change how you would approach a data exposure investigation?
- How does automatic classification without a predefined policy change the traditional DLP deployment model?
Full data lineage from content to user. This drill-down demonstrates the complete chain — content classification → application → user — without any policy configuration. It's the foundation that makes targeted enforcement in Labs 6, 7, and 8 possible.
Lab Summary
In this lab you established foundational visibility into SaaS usage and sensitive data activity:
| Task | What you did |
|---|---|
| Task 1 | Discovered shadow IT applications and reviewed risk profiles |
| Task 2 | Identified application instances and user-level activity |
| Task 3 | Observed automatic ML-based content classification |
These capabilities provide the visibility required before implementing data protection and enforcement controls in subsequent labs.
Explore available filters, tabs, and drill-downs beyond the examples. Dashboard values and application lists may vary.
Task 1 — SaaS Security Posture Management (SSPM)
Step 1 — Navigate to the SSPM Portal
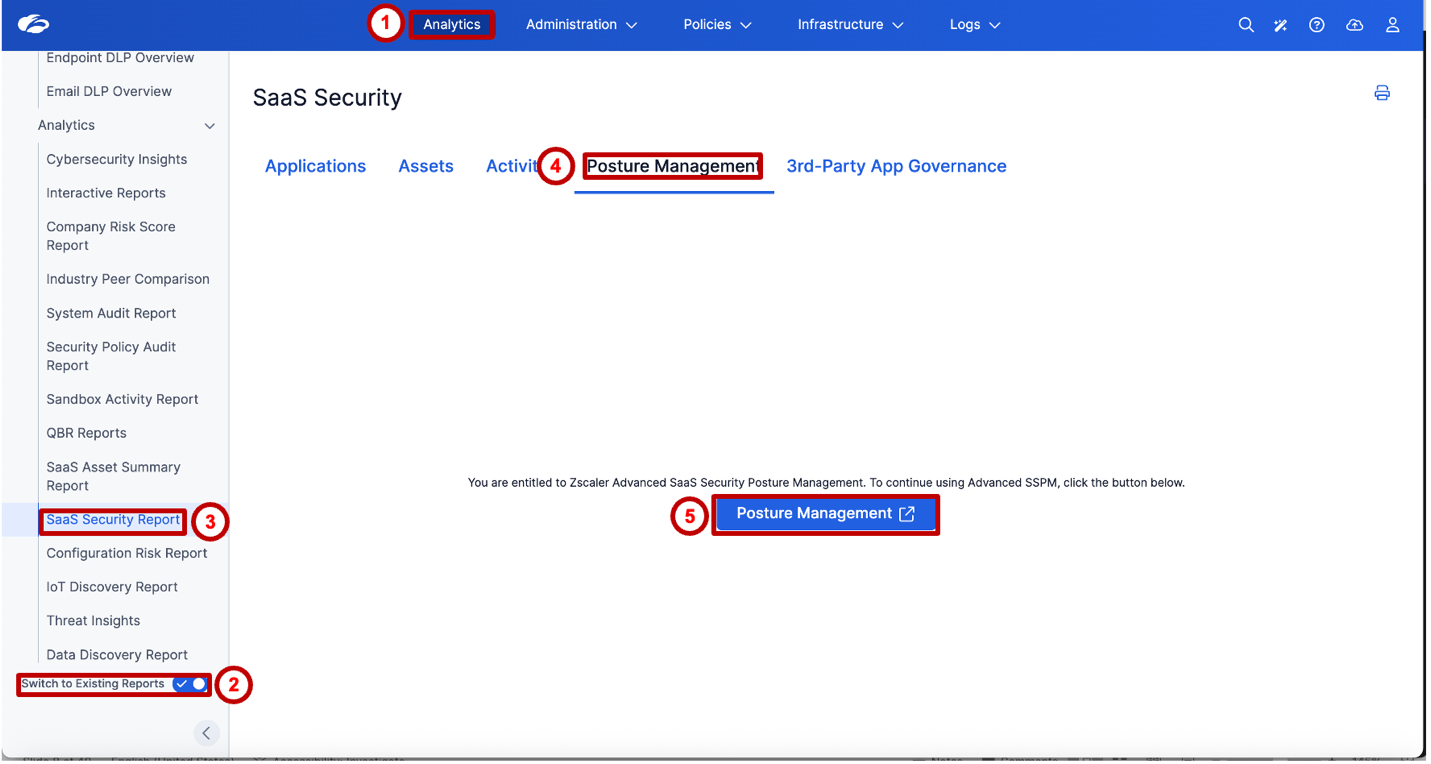
- In the Experience Center, enable Switch to Existing Reports and open Analytics → SaaS Security Report.
- Select Posture Management.
- Click Posture Management ↗ to launch the SSPM portal at
apptotal.zscaler.com.
Step 2 — Review the SSPM Dashboard
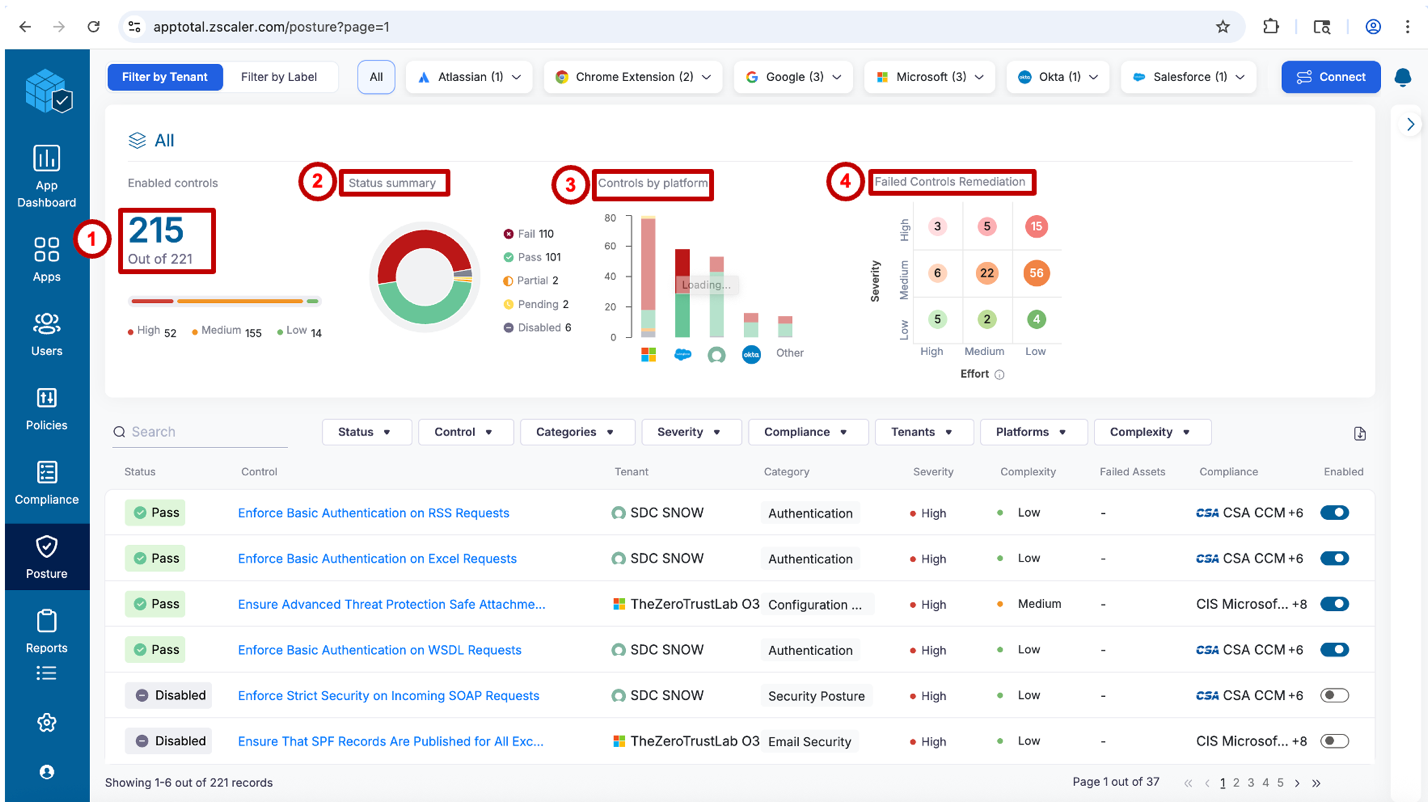
Review:
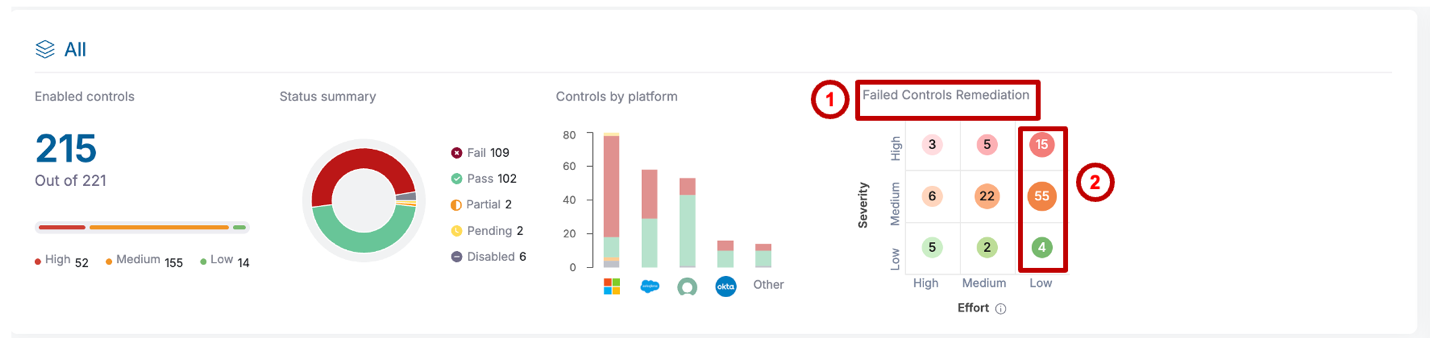
- Enabled Controls — active controls and severity breakdown.
- Status Summary — Fail, Pass, Partial, Pending, and Disabled.
- Controls by Platform — compare findings across SaaS platforms.
- Failed Controls Remediation Matrix — compare severity and remediation effort.
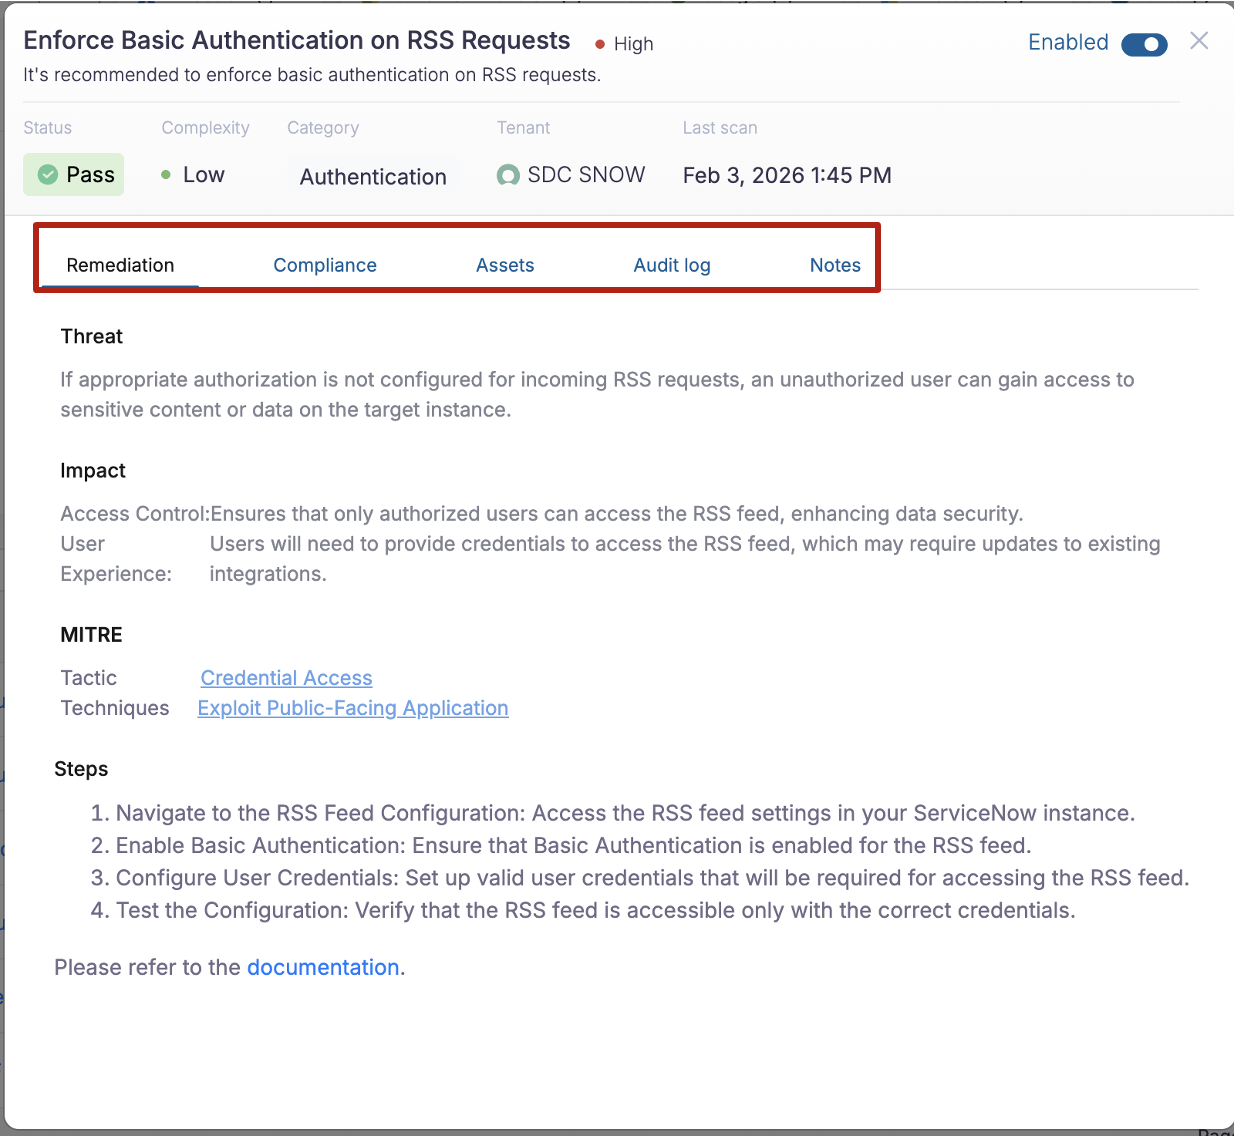
Select a control and explore Remediation, Compliance, Assets, Audit log, and Notes. Identify what failed, which assets are affected, and the recommended remediation.
Step 3 — Prioritize Failed Controls
Review the Failed Controls Remediation Matrix. Start with High Severity / Low Effort findings, then compare other cells to understand the trade-off between risk and remediation effort.
Step 4 — Review Compliance Mapping
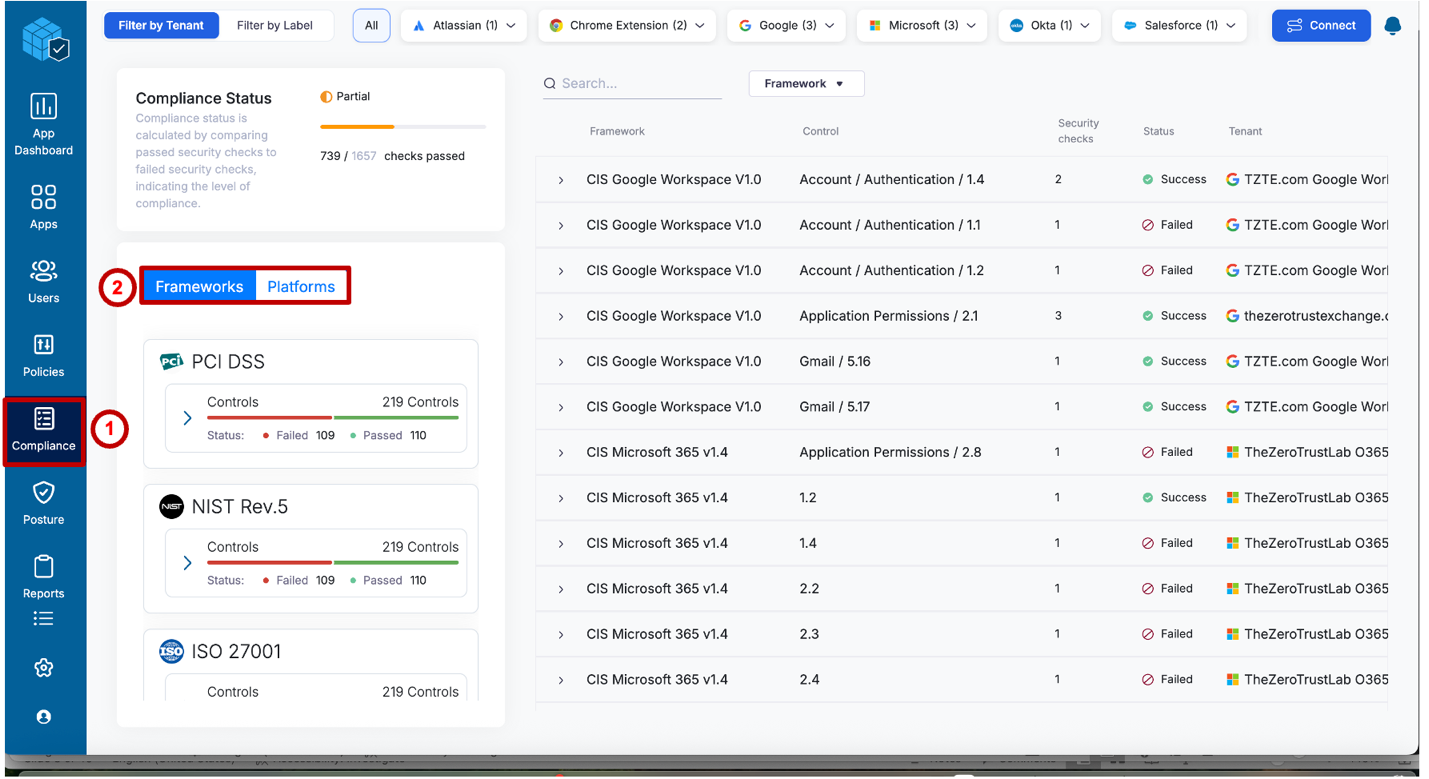
Select Compliance in the left navigation.
- Frameworks: expand a framework to review its controls and pass/fail results.
- Platforms: compare compliance findings across SaaS platforms.
- Review the mapping table's Framework, Control ID, Security Check count, Status, and Tenant.
Consider which failed control would be most useful to address first, based on severity, effort, and compliance relevance.
Task 2 — Third-Party Application Governance
Step 5 — Review the App Dashboard
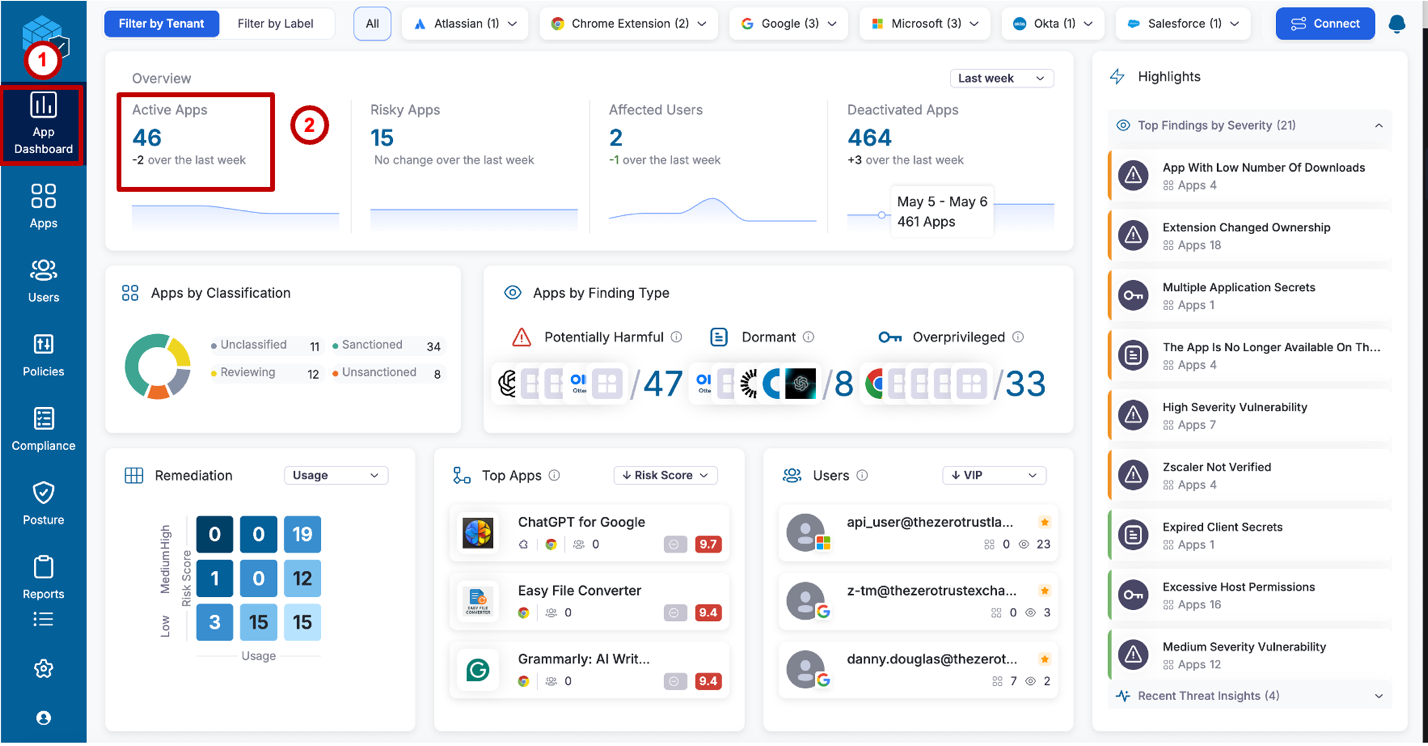
Select App Dashboard in the SSPM portal.
Review Active Apps, Risky Apps, Affected Users, and Deactivated Apps. Then explore:
- Apps by Classification — Sanctioned, Unsanctioned, Reviewing, and Unclassified.
- Apps by Finding Type — Potentially Harmful, Dormant, and Overprivileged.
- Top Apps by Risk Score and Highlights — identify apps worth investigating.
Step 6 — Review Active Apps and App Detail
Select Apps → Active Apps (App Status: Enabled). Compare each app's Publisher, Platform, Users, Risk Score, and Access Type.
Open an app, such as Keeper® Password, and review:
| Tab | What to examine |
|---|---|
| Overview | Classification, risk score, connection graph, and usage timeline |
| Access | Permission scopes and OAuth grants |
| Activities | Recent app activity |
| Details | Publisher, marketplace metadata, and findings |
| Notes | Existing review history |
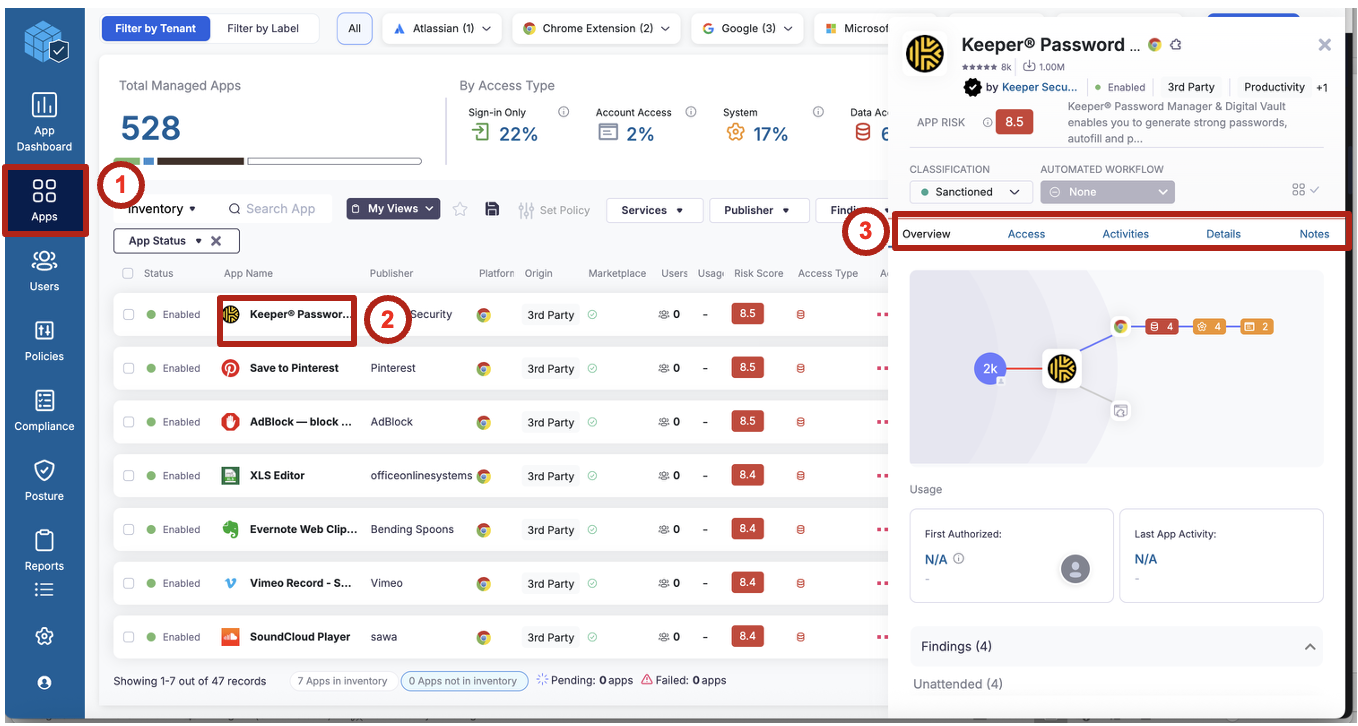
Compare the permissions granted with the app's business purpose. OAuth integrations can access SaaS data directly, making this an important view alongside inline traffic inspection.
Key Takeaways
- SSPM: identify SaaS misconfigurations and affected assets.
- Remediation and compliance: prioritize findings using severity, effort, and framework mappings.
- App Governance: review third-party permissions, activity, and risk.
What comes next: Lab 3 moves to endpoint data, user activity, applications, and connected-device inventory.
The steps are a starting point. Explore available filters, tabs, linked records, information icons, and View All options. Try other users, departments, application categories, and device types.
1. Open the Endpoint Data Scan Dashboard
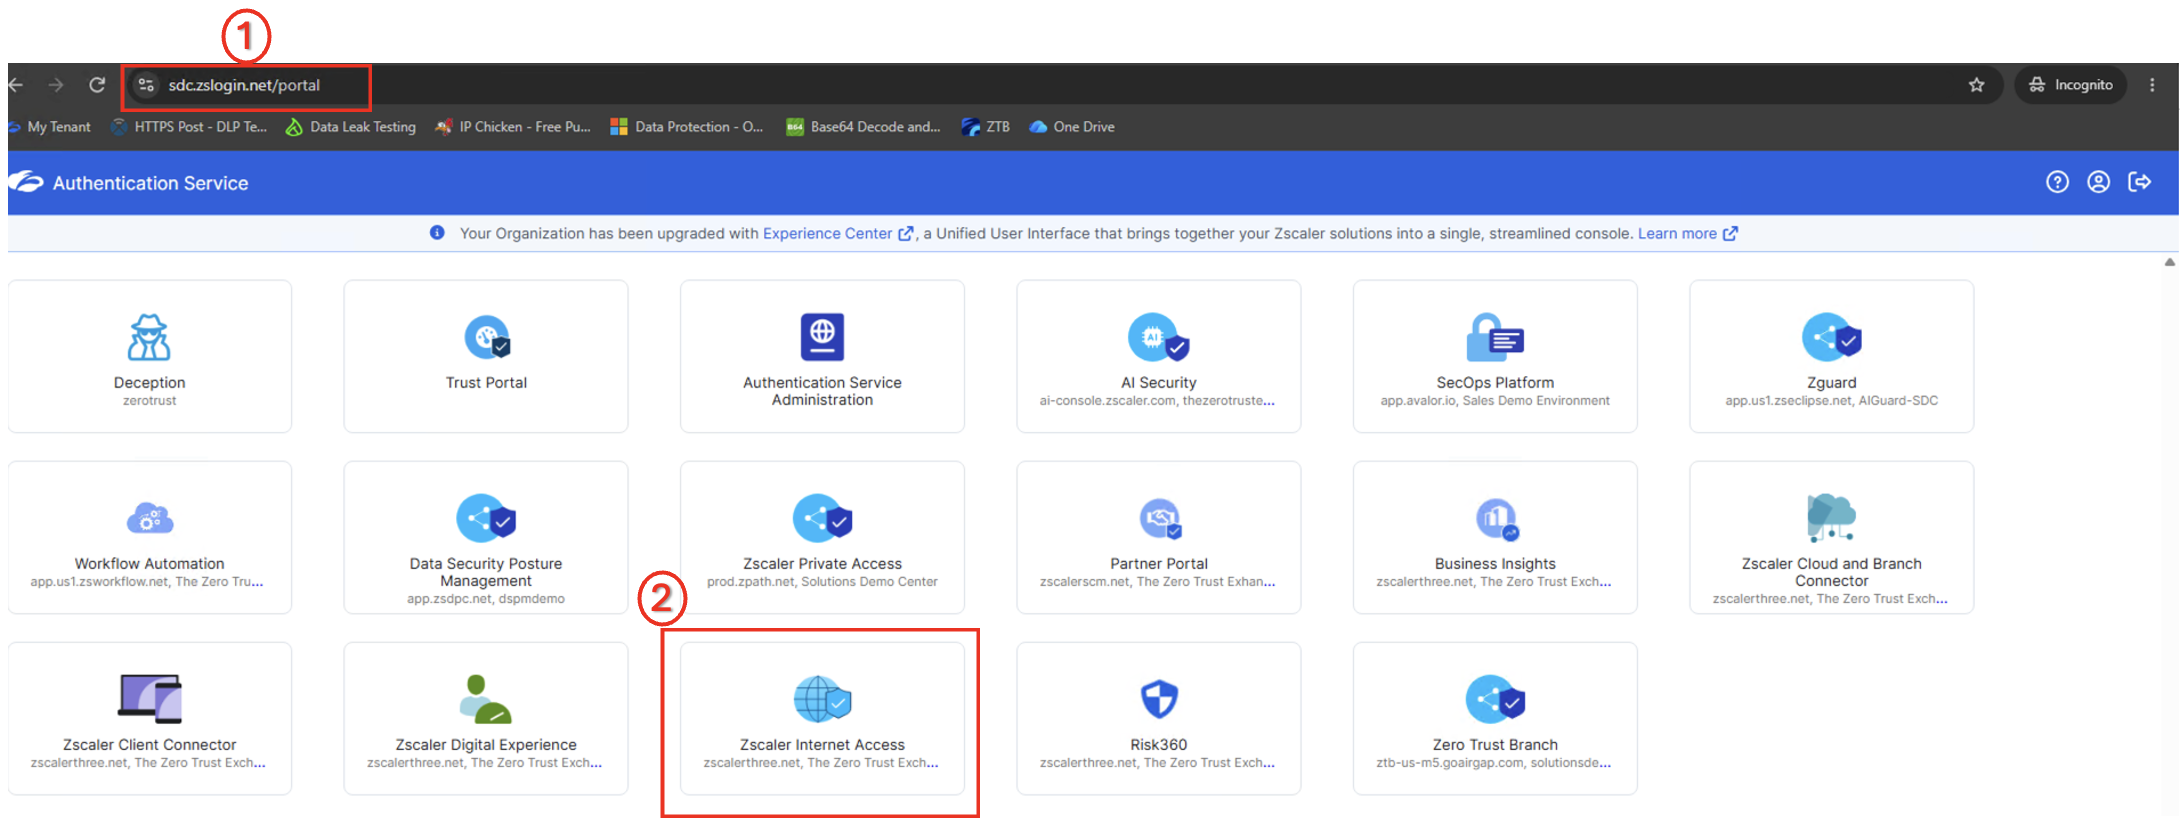
Step 1 — Launch Zscaler Internet Access
Log in to the Solution Demo Centre portal at sdc.zslogin.net/portal, then select Zscaler Internet Access.
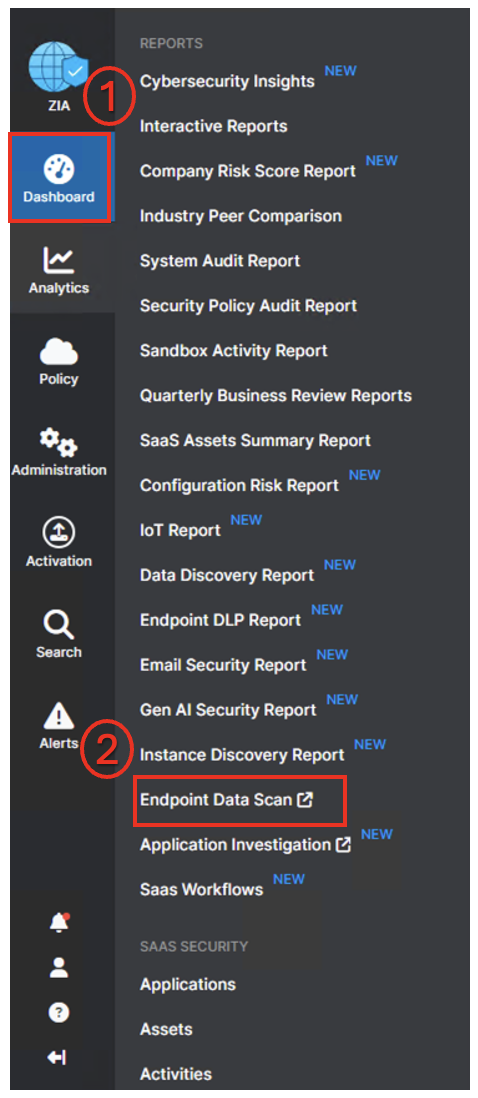
Step 2 — Navigate to Endpoint Data Scan
In the ZIA console, open Dashboard and select Endpoint Data Scan under Reports.
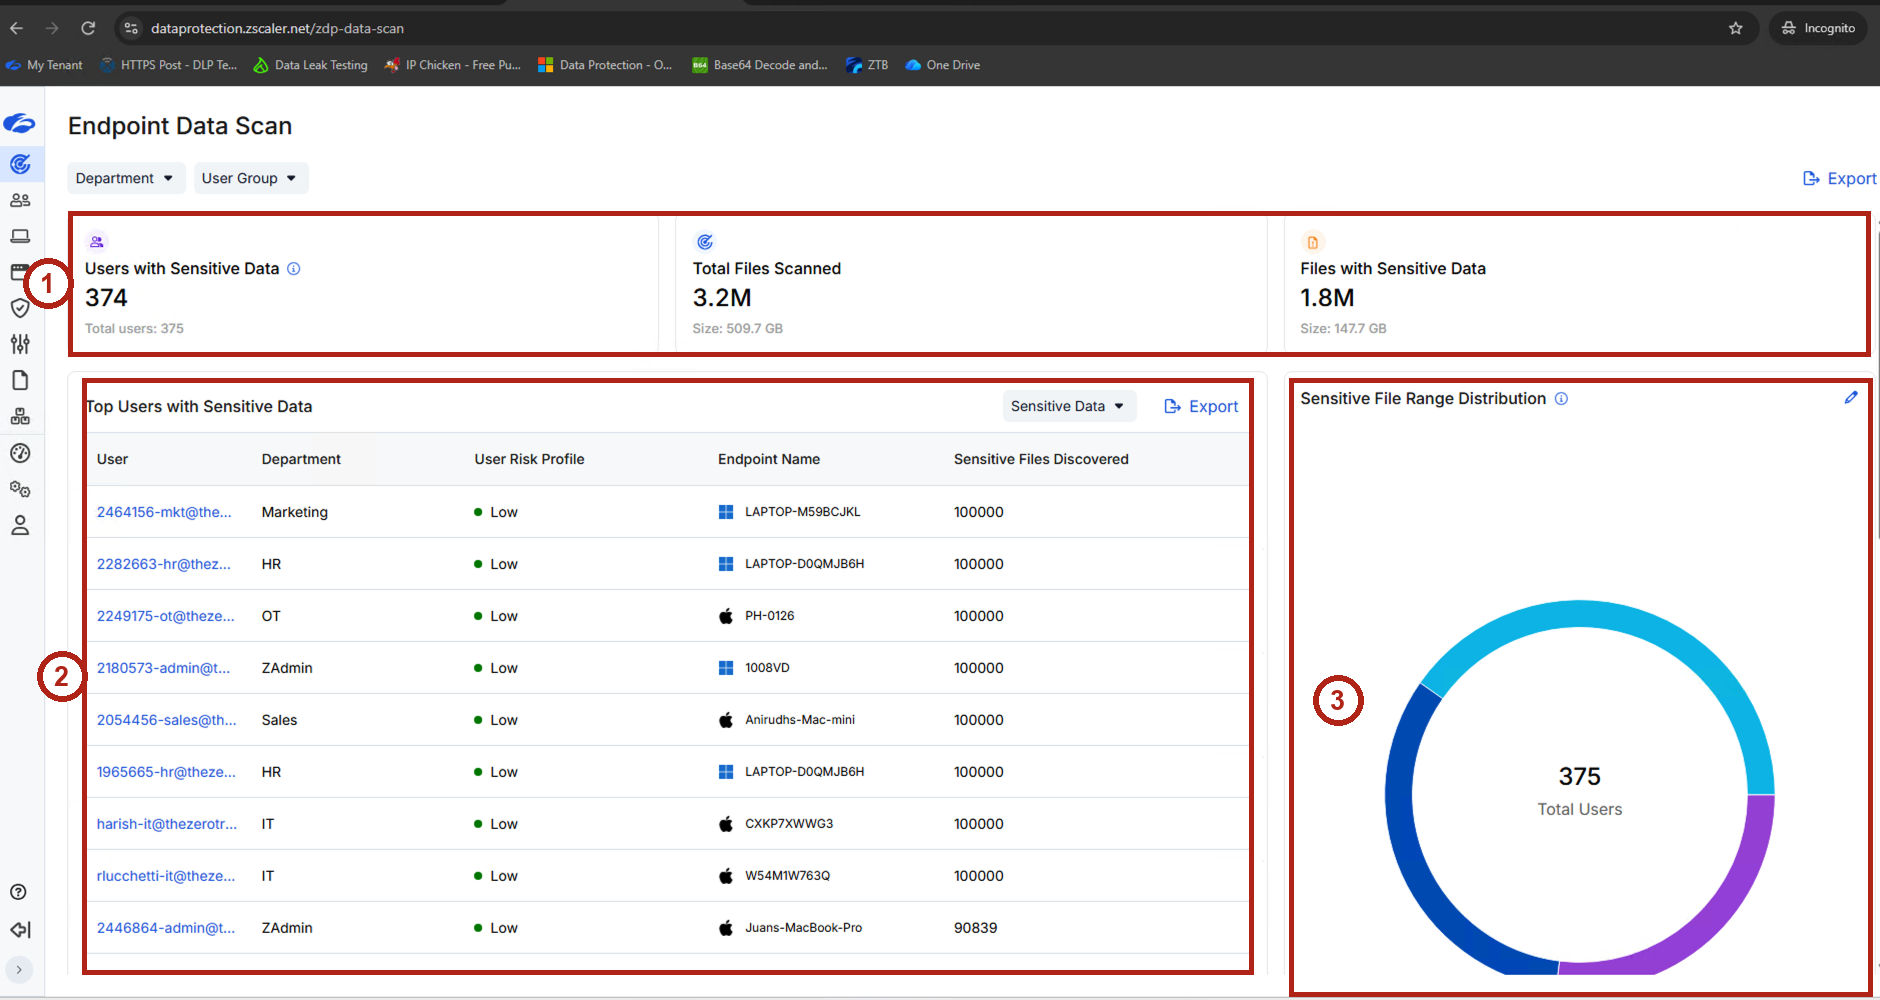
Step 3 — Review the Dashboard Layout
Locate the summary tiles, Top Users with Sensitive Data, and Sensitive File Range Distribution.
2. Review the Endpoint Data Posture
Step 4 — Review the Summary Tiles
Review the three summary tiles at the top of the dashboard. Numbers may vary on your dashboard. Values shown below are screenshot examples, not expected results.

| Tile | Screenshot example | What it shows |
|---|---|---|
| Users with Sensitive Data | 374 of 375 users | Users with sensitive files on their endpoints |
| Total Files Scanned | 3.2M · 509.7 GB | Scanned file count and size |
| Files with Sensitive Data | 1.8M · 147.7 GB | Files containing classified sensitive data |
Compare the proportion of users with sensitive data and the proportion of scanned files classified as sensitive.
3. Review Users and Endpoints
Review Top Users with Sensitive Data in the dashboard overview.
| Column | What it shows |
|---|---|
| User | Associated user account |
| Department | User's department |
| User Risk Profile | Risk profile calculated in ZIA |
| Endpoint Name | Associated endpoint and platform |
| Sensitive Files Discovered | Number of sensitive files discovered |
User Risk Profile is calculated in ZIA, not from the sensitive-file count shown here. Review it alongside the endpoint data findings.
Explore the Department, User Group, and Sensitive Data selectors to compare results.
4. Review Data Classifications
Step 5 — Explore the Classification Widgets
Scroll down to the classification widgets.
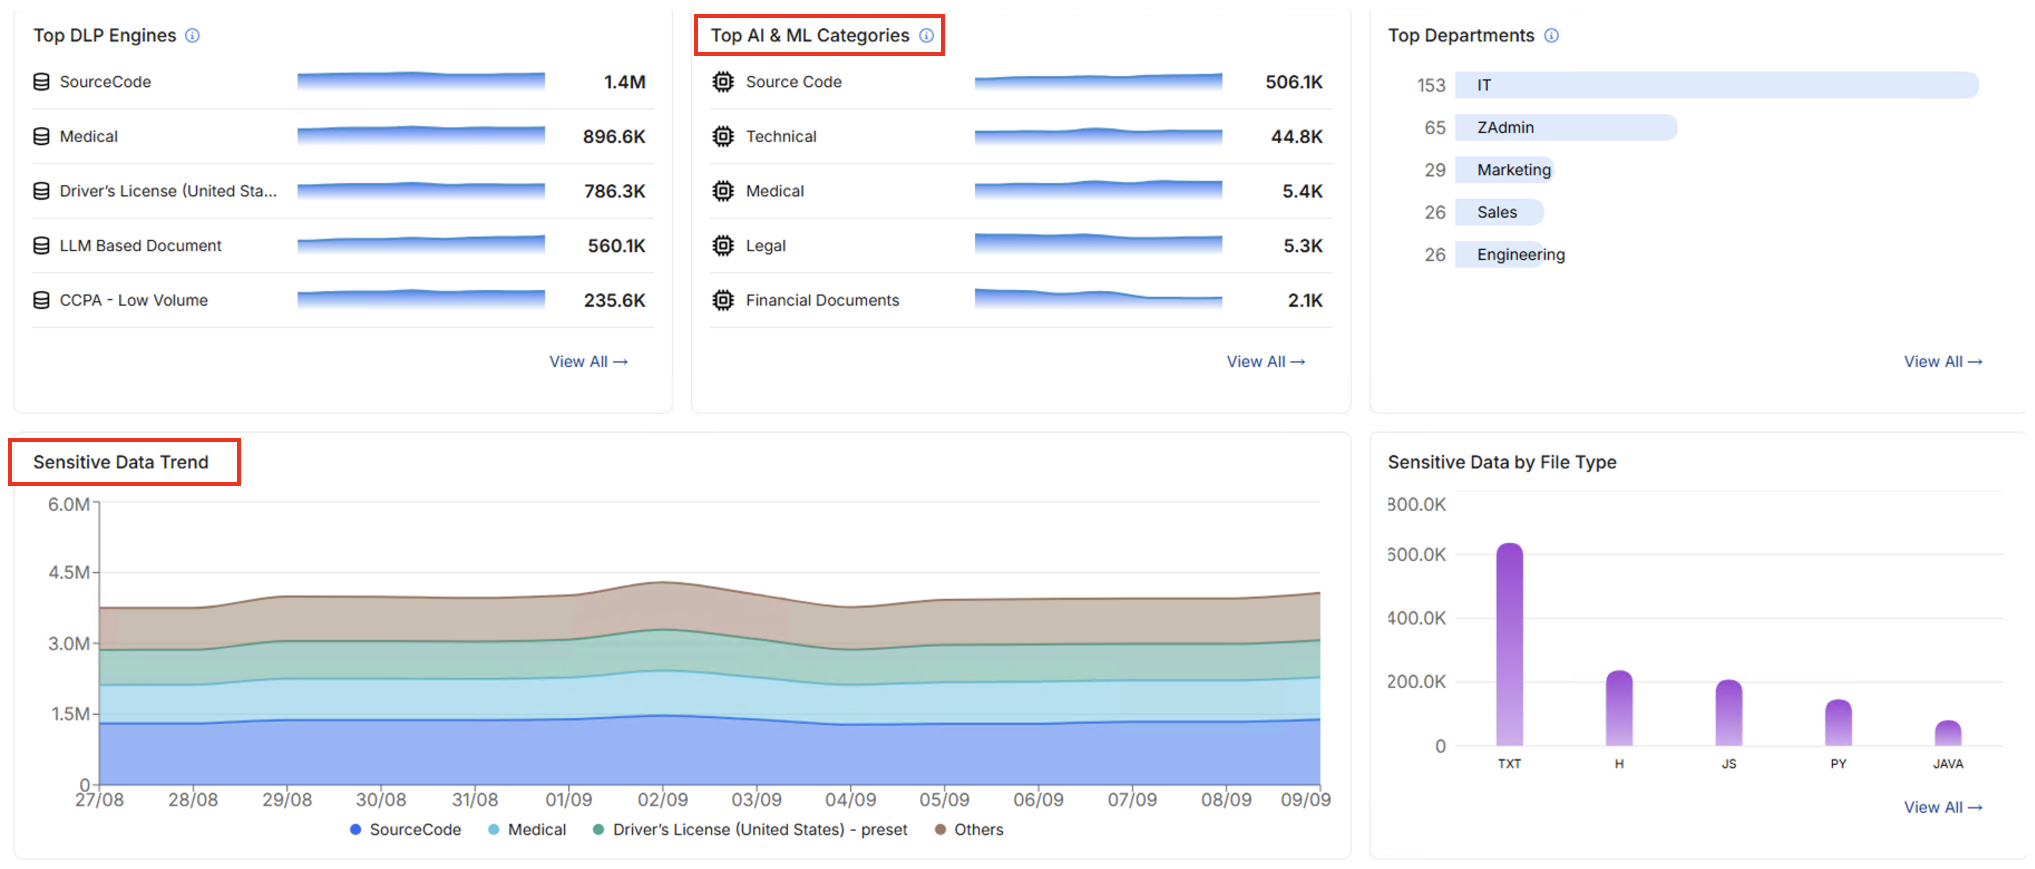
| Widget | What to review |
|---|---|
| Top DLP Engines | Leading engine matches, such as SourceCode, Medical, and Driver's License |
| Top AI & ML Categories | Content categories such as Source Code, Technical, and Financial Documents |
| Top Departments | Department breakdown |
| Sensitive Data Trend | Changes over the reporting window |
| Sensitive Data by File Type | File extensions associated with sensitive data |
Use View All where available. Compare classifications, departments, and file types; a file can match more than one classification.
5. Review the Sensitive File Range Distribution
Review Sensitive File Range Distribution in the dashboard overview. The example groups users into:
- More than 100 files
- 25 – 100 files
- Less than 25 files
Check whether sensitive data is concentrated among a few users or spread across the user population.
6. Investigate a User's Endpoint Data
Step 6 — Open User Investigation
Select User Investigation using the people icon in the left navigation. Use the User filter to locate 2305990-sales@thezerotrustlab.com and open the user. You can also sort by Incidents to explore other users.
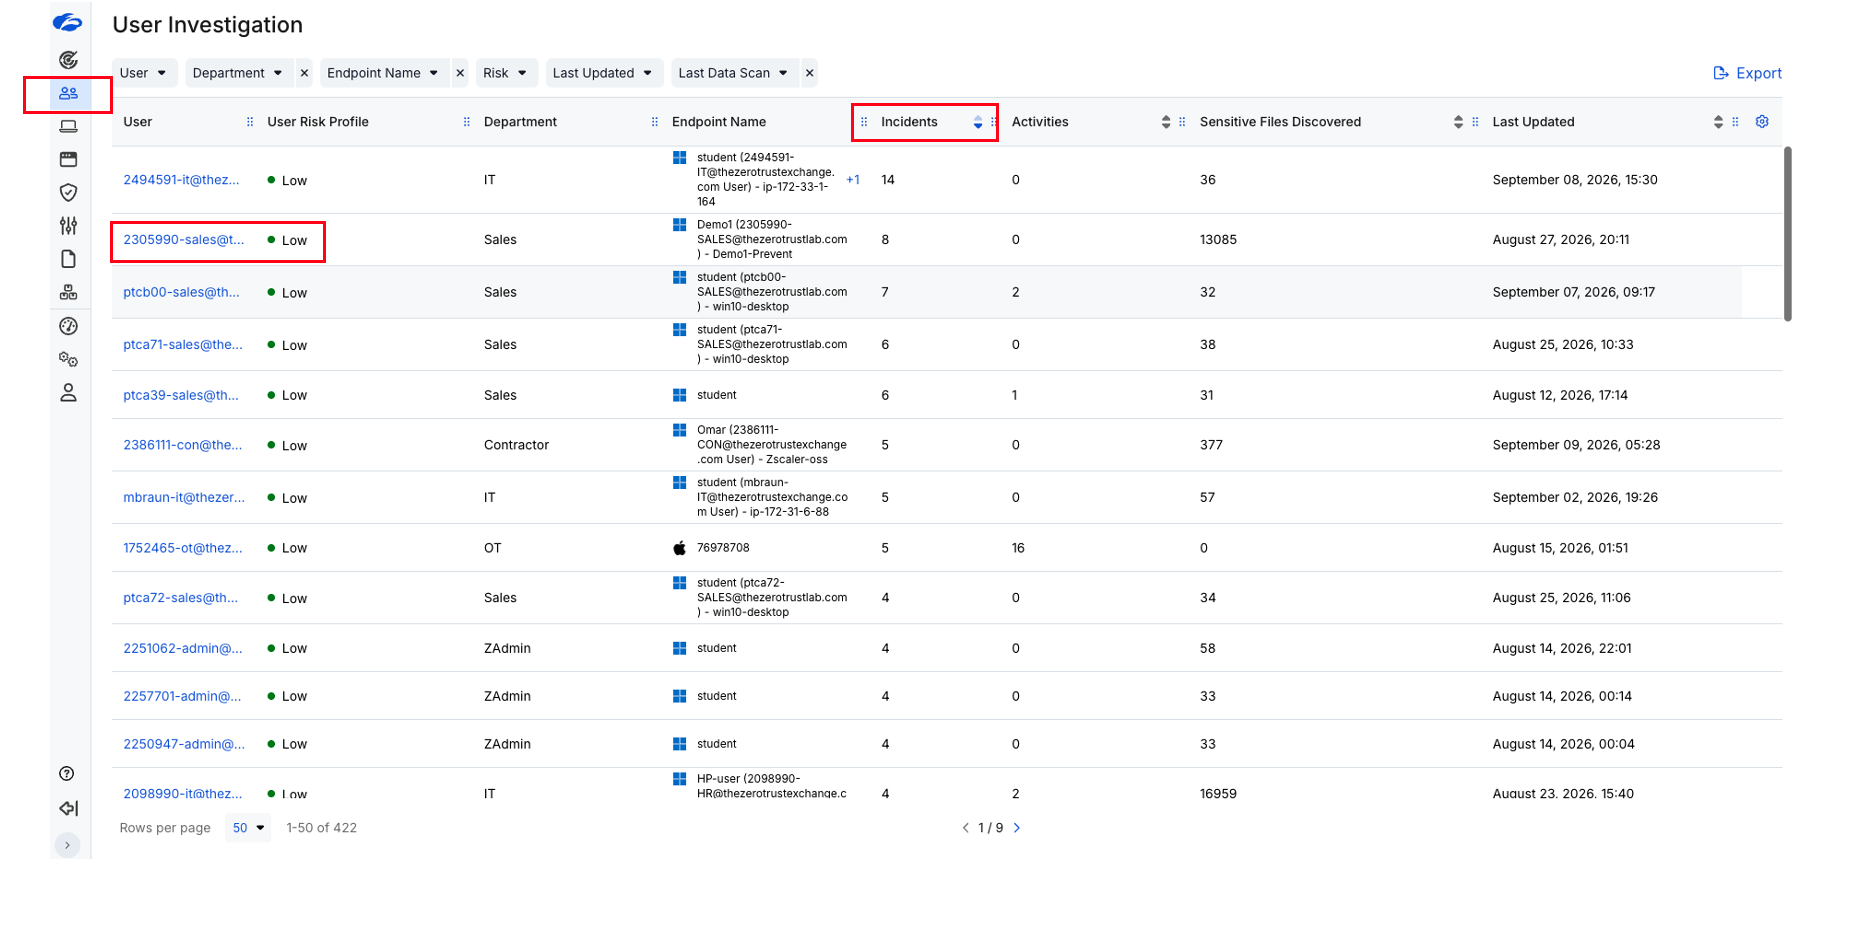
Exact incident numbers and types of incidents may vary in your tenant. Dates, file counts, and other dashboard values may also differ from the screenshots. Use the available records to explore the same fields and views.
Step 7 — Review the User Overview
Confirm the selected user is 2305990-sales@thezerotrustlab.com, then review Overview.
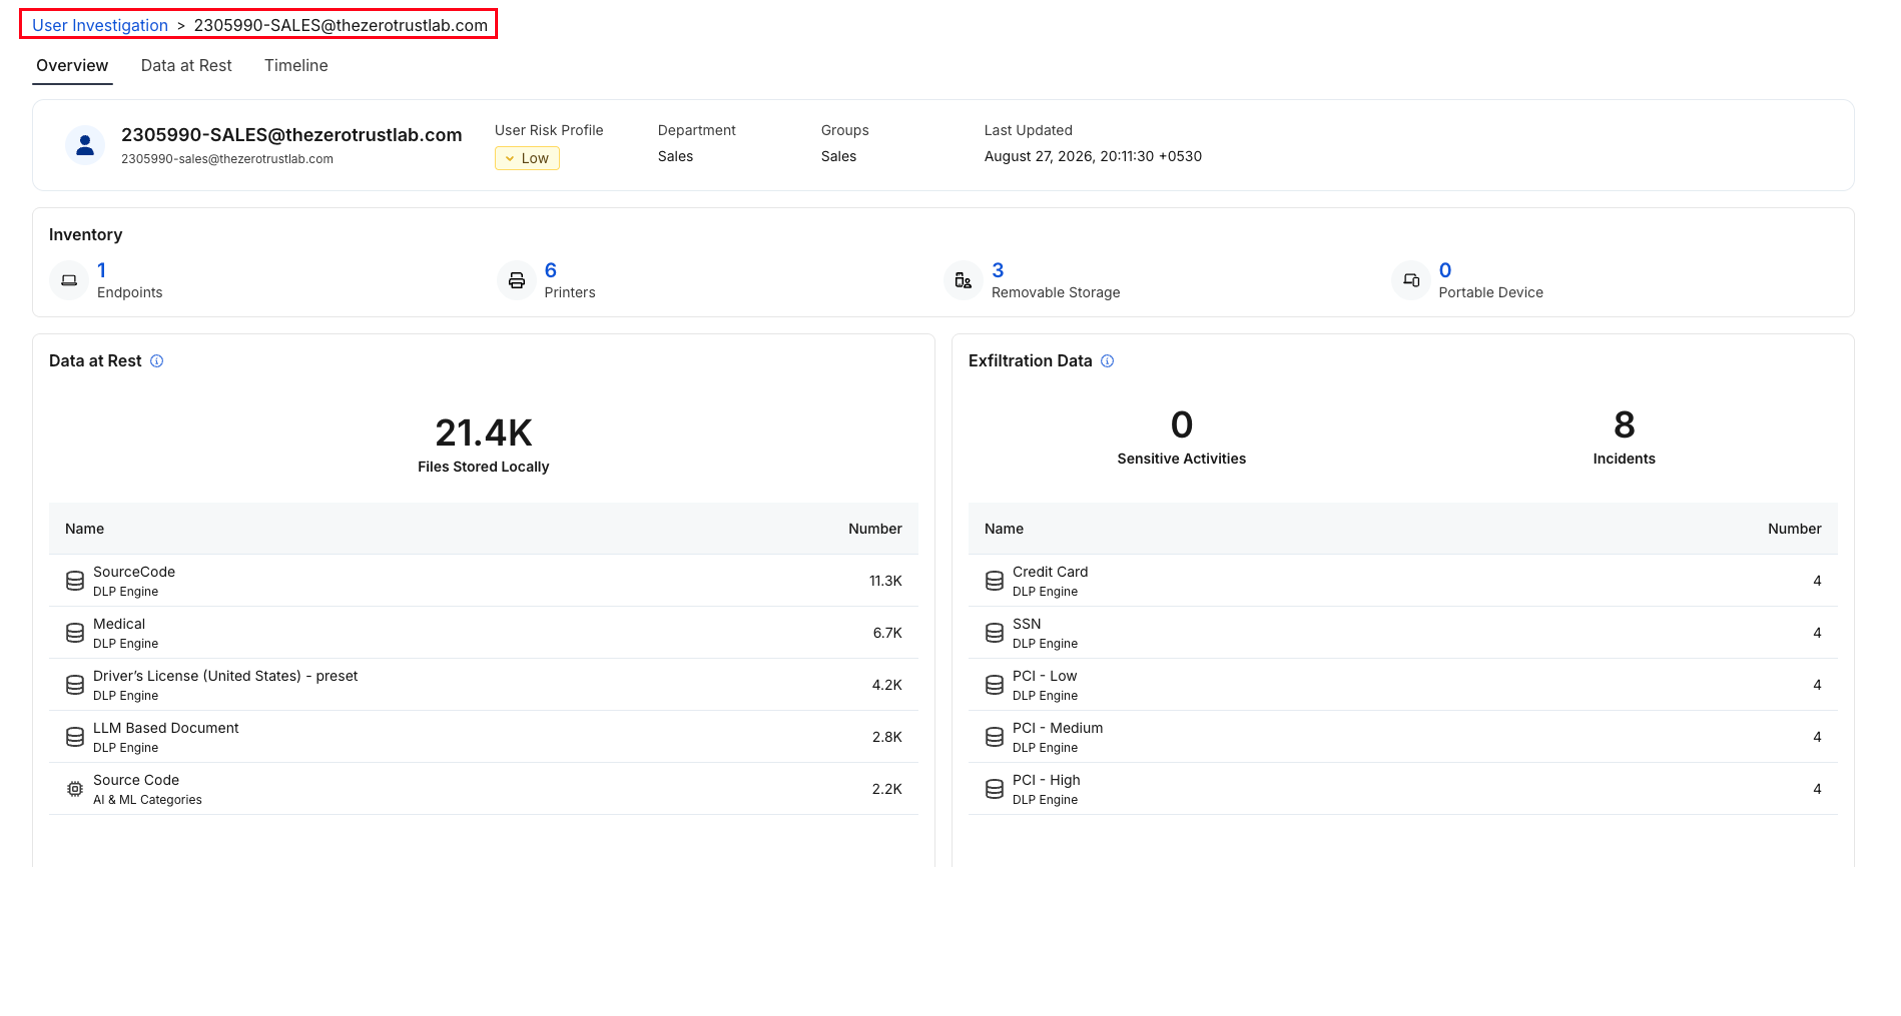
| Area | What to review |
|---|---|
| User details | Department, group, ZIA-calculated risk profile, and last-updated time |
| Inventory | Endpoints, printers, removable storage, and portable devices |
| Data at Rest | Locally stored files and their classifications |
| Exfiltration Data | Sensitive activities, incidents, and associated DLP engines |
Step 8 — Inspect Data at Rest
Open Data at Rest to review scan results and individual files.
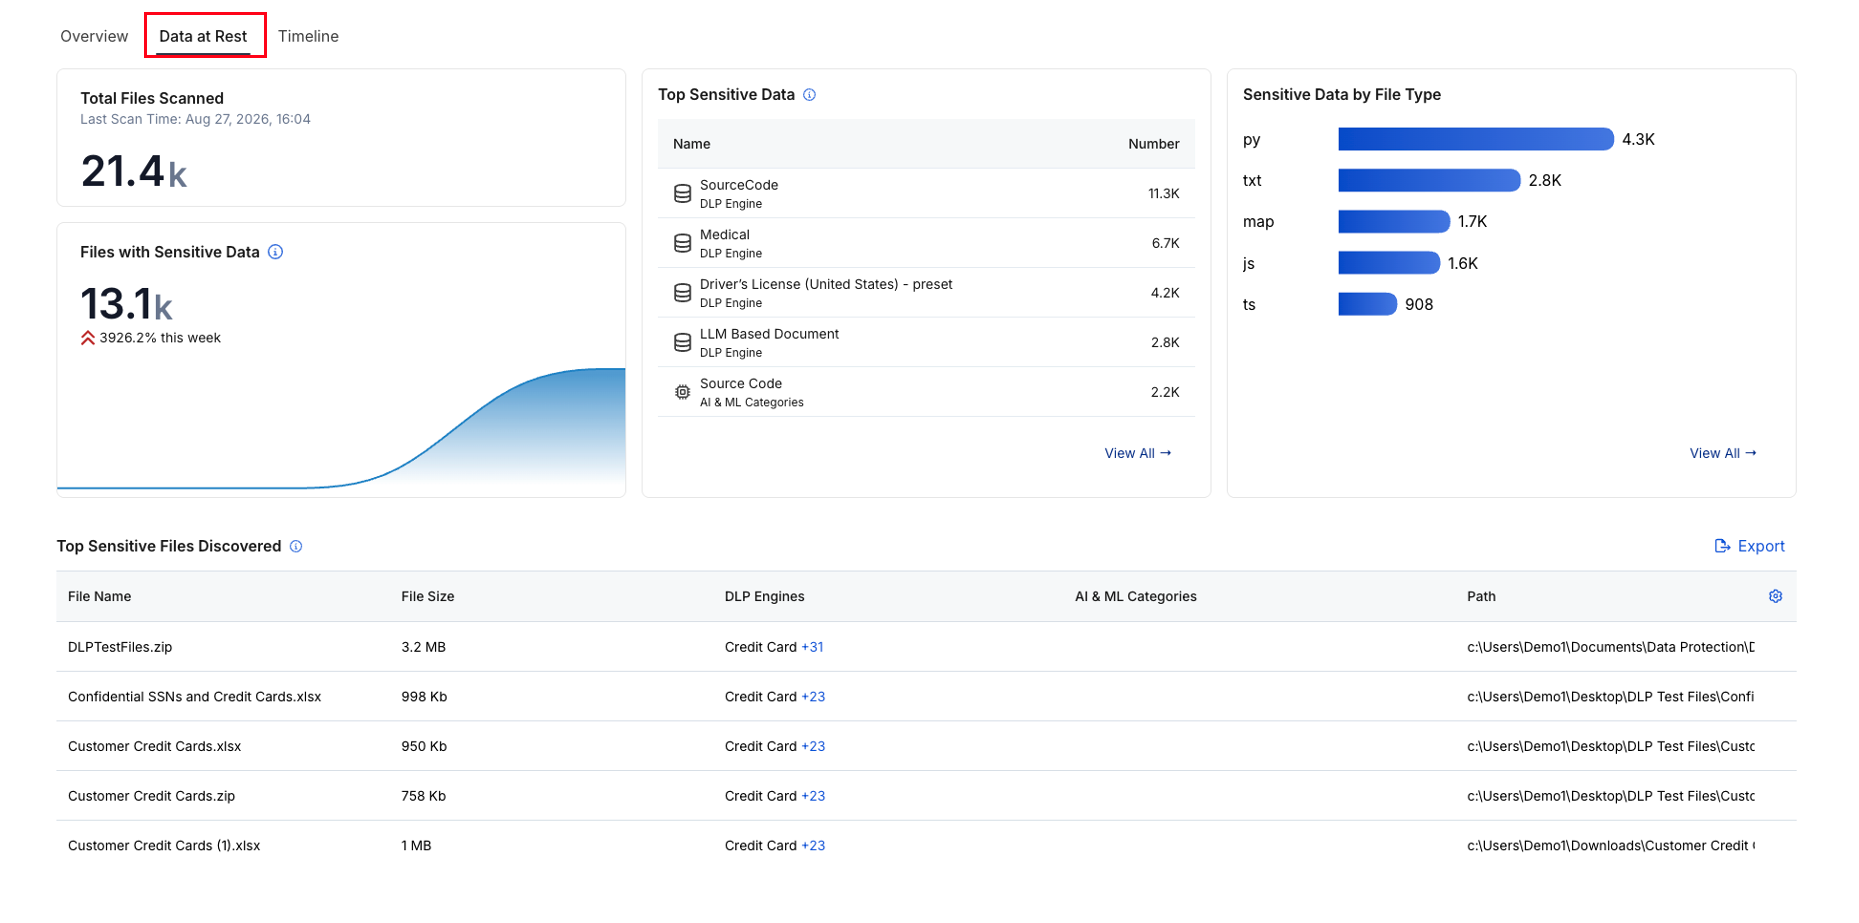
Review Total Files Scanned, Last Scan Time, Files with Sensitive Data, Top Sensitive Data, and Sensitive Data by File Type.
In Top Sensitive Files Discovered, locate Customer Credit Cards.xlsx if present, or choose another file. Review its File Size, DLP Engines, AI & ML Categories, and Path. Explore View All and additional classification matches where available.
Step 9 — Review the User Timeline
Open Timeline and select an incident. The screenshot uses PCI High Print Block from August 27, 2026 at 20:11; if it is not available, select another incident and review the same fields. Incident numbers and types may vary.
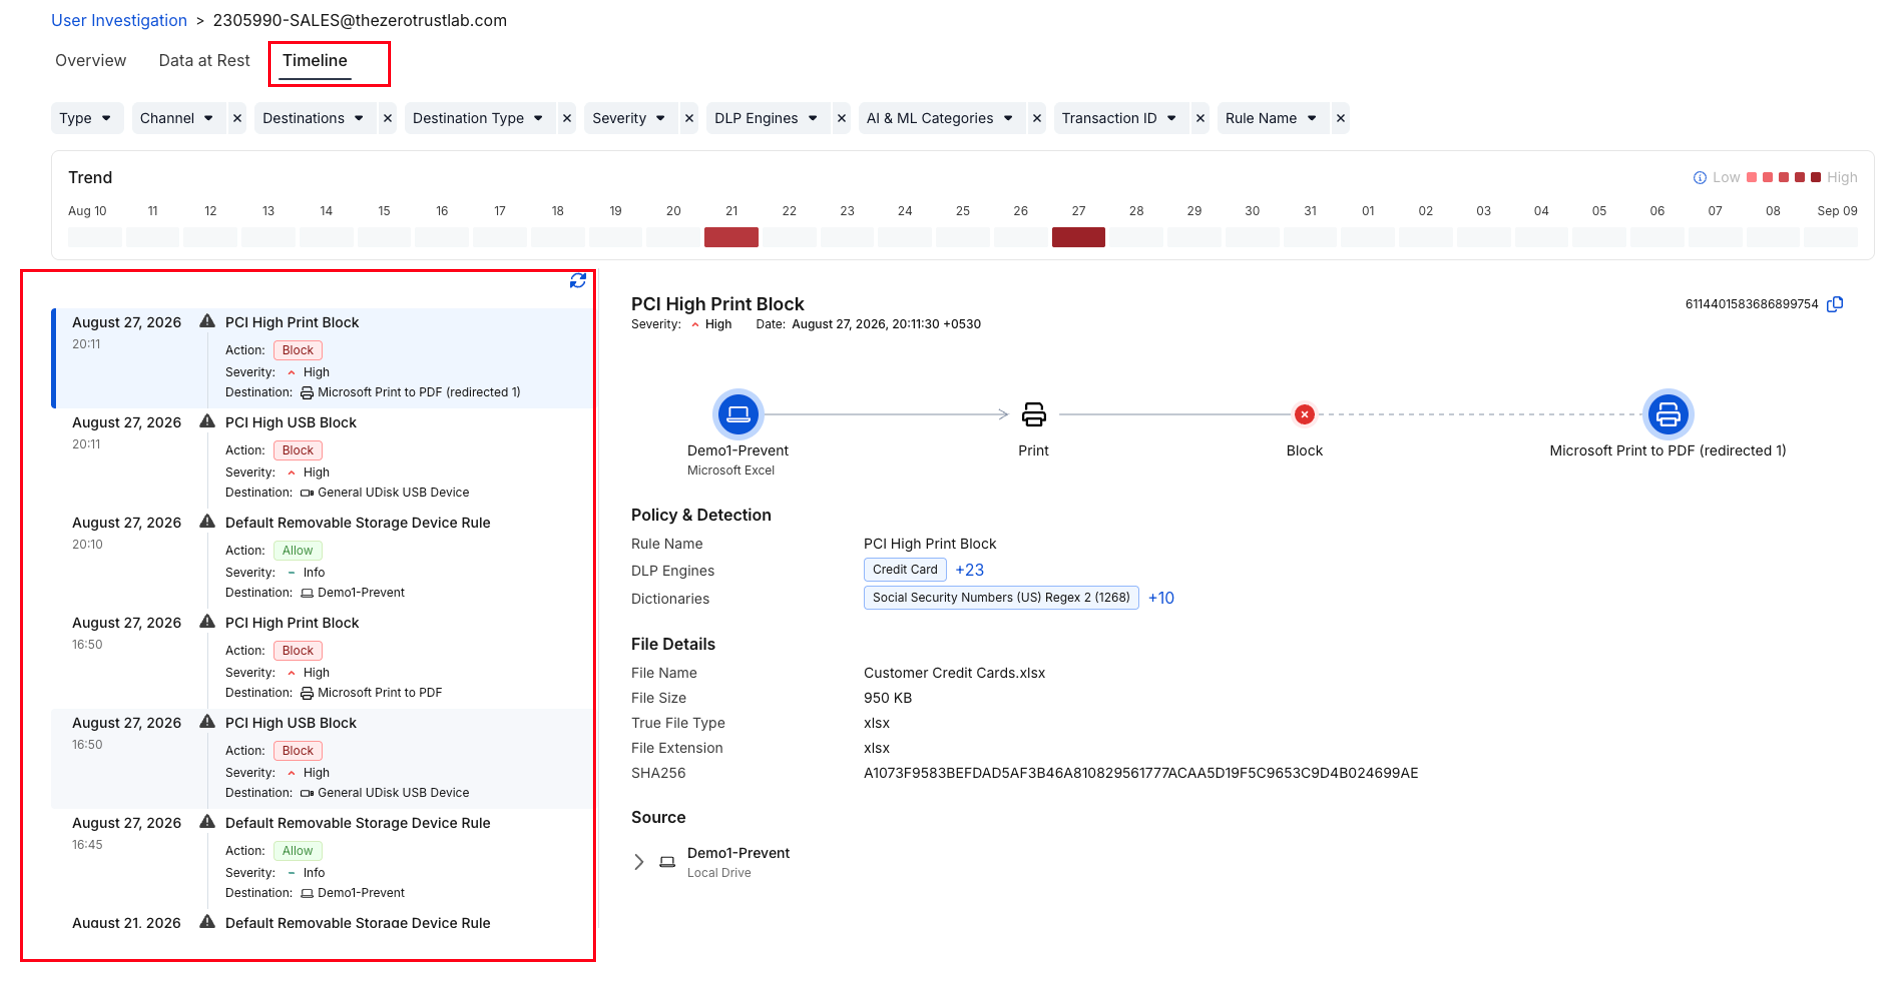
| Detail | What to review |
|---|---|
| Action and severity | Recorded outcome and severity |
| Endpoint and application | Source endpoint and application |
| Channel and destination | How and where the action was attempted |
| Policy & Detection | Rule, DLP engines, and dictionary matches |
| File Details | Filename, size, type, extension, and hash |
| Source | Source device and location |
Compare other events and use the available Timeline filters. A Block action records a prevented attempt; an Allow device event does not establish that a sensitive-file transfer succeeded.
7. Explore Endpoint Applications and Connected Devices
Step 10 — Explore Application Investigation
Select Application Investigation in the left navigation and open Overview.
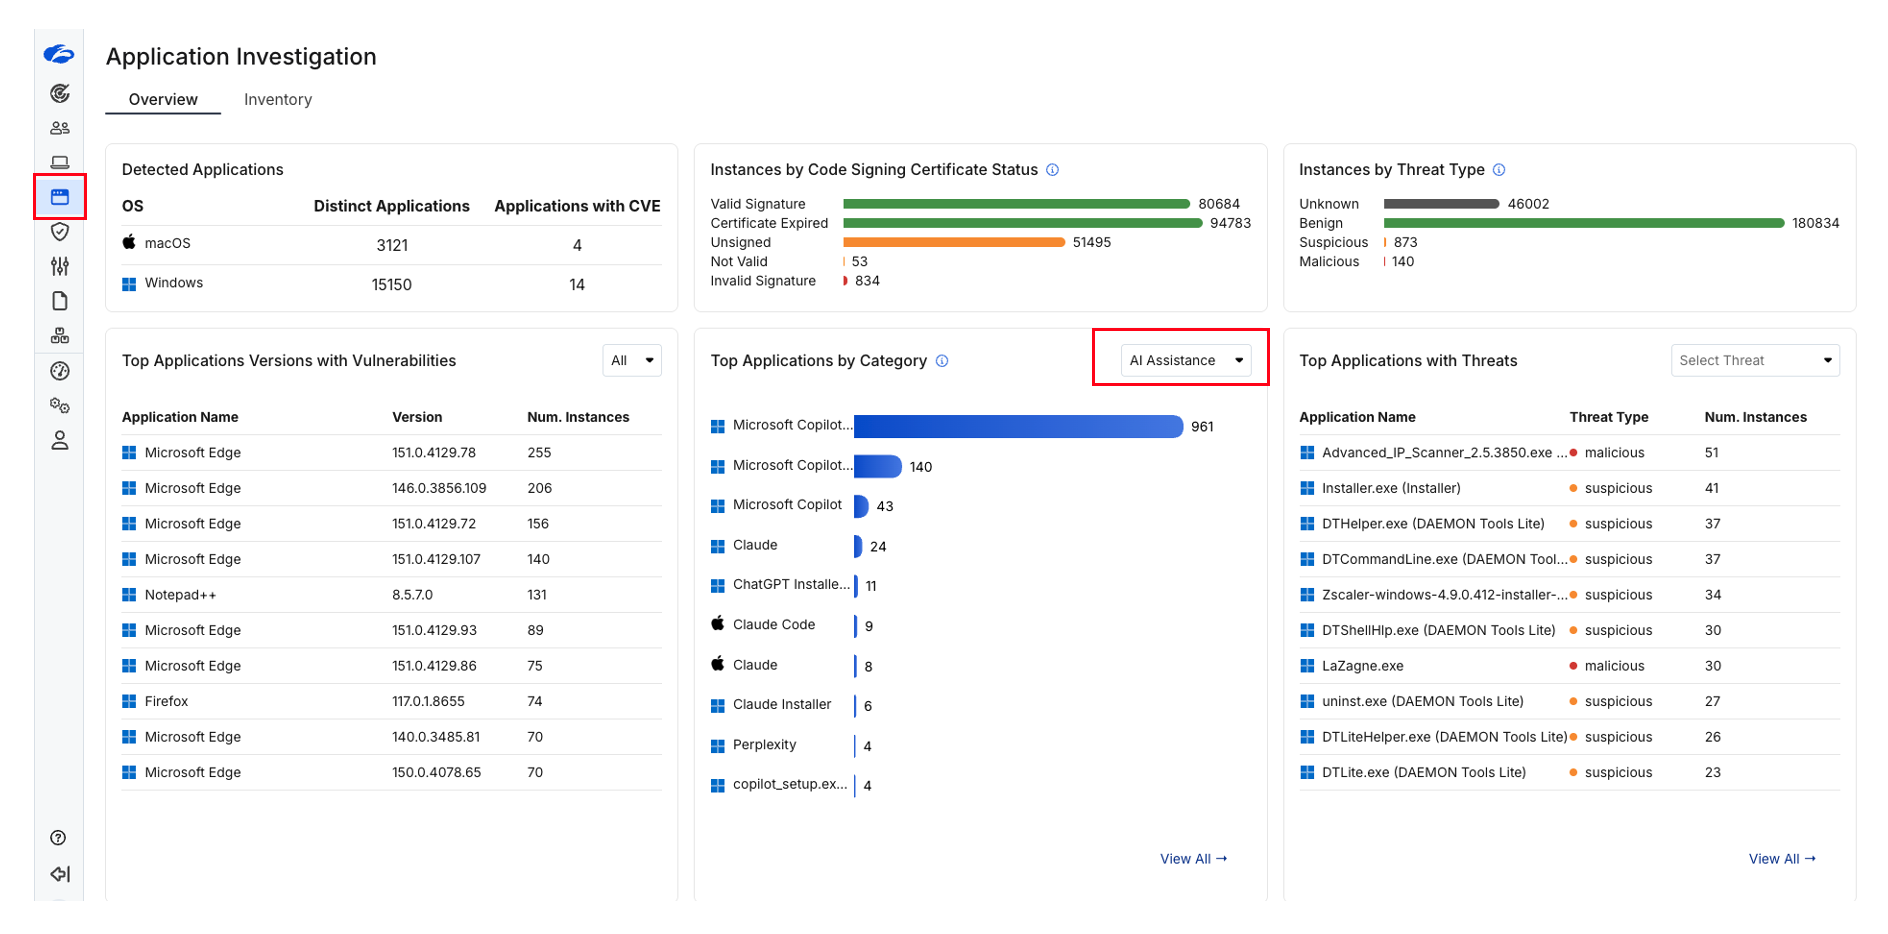
| Widget | What to explore |
|---|---|
| Detected Applications | Applications and applications with CVEs across macOS and Windows |
| Instances by Code Signing Certificate Status | Signature and certificate status |
| Instances by Threat Type | Reported threat classifications |
| Top Applications Versions with Vulnerabilities | Application versions and instance counts |
| Top Applications by Category | Select AI Assistance, then try other categories |
| Top Applications with Threats | Use Select Threat and View All |
Open the Inventory tab and explore available application details. Compare categories and versions rather than stopping at the screenshot example.
Step 11 — Explore Connected-Device Inventory
Select Inventory in the left navigation, then Removable Storage.
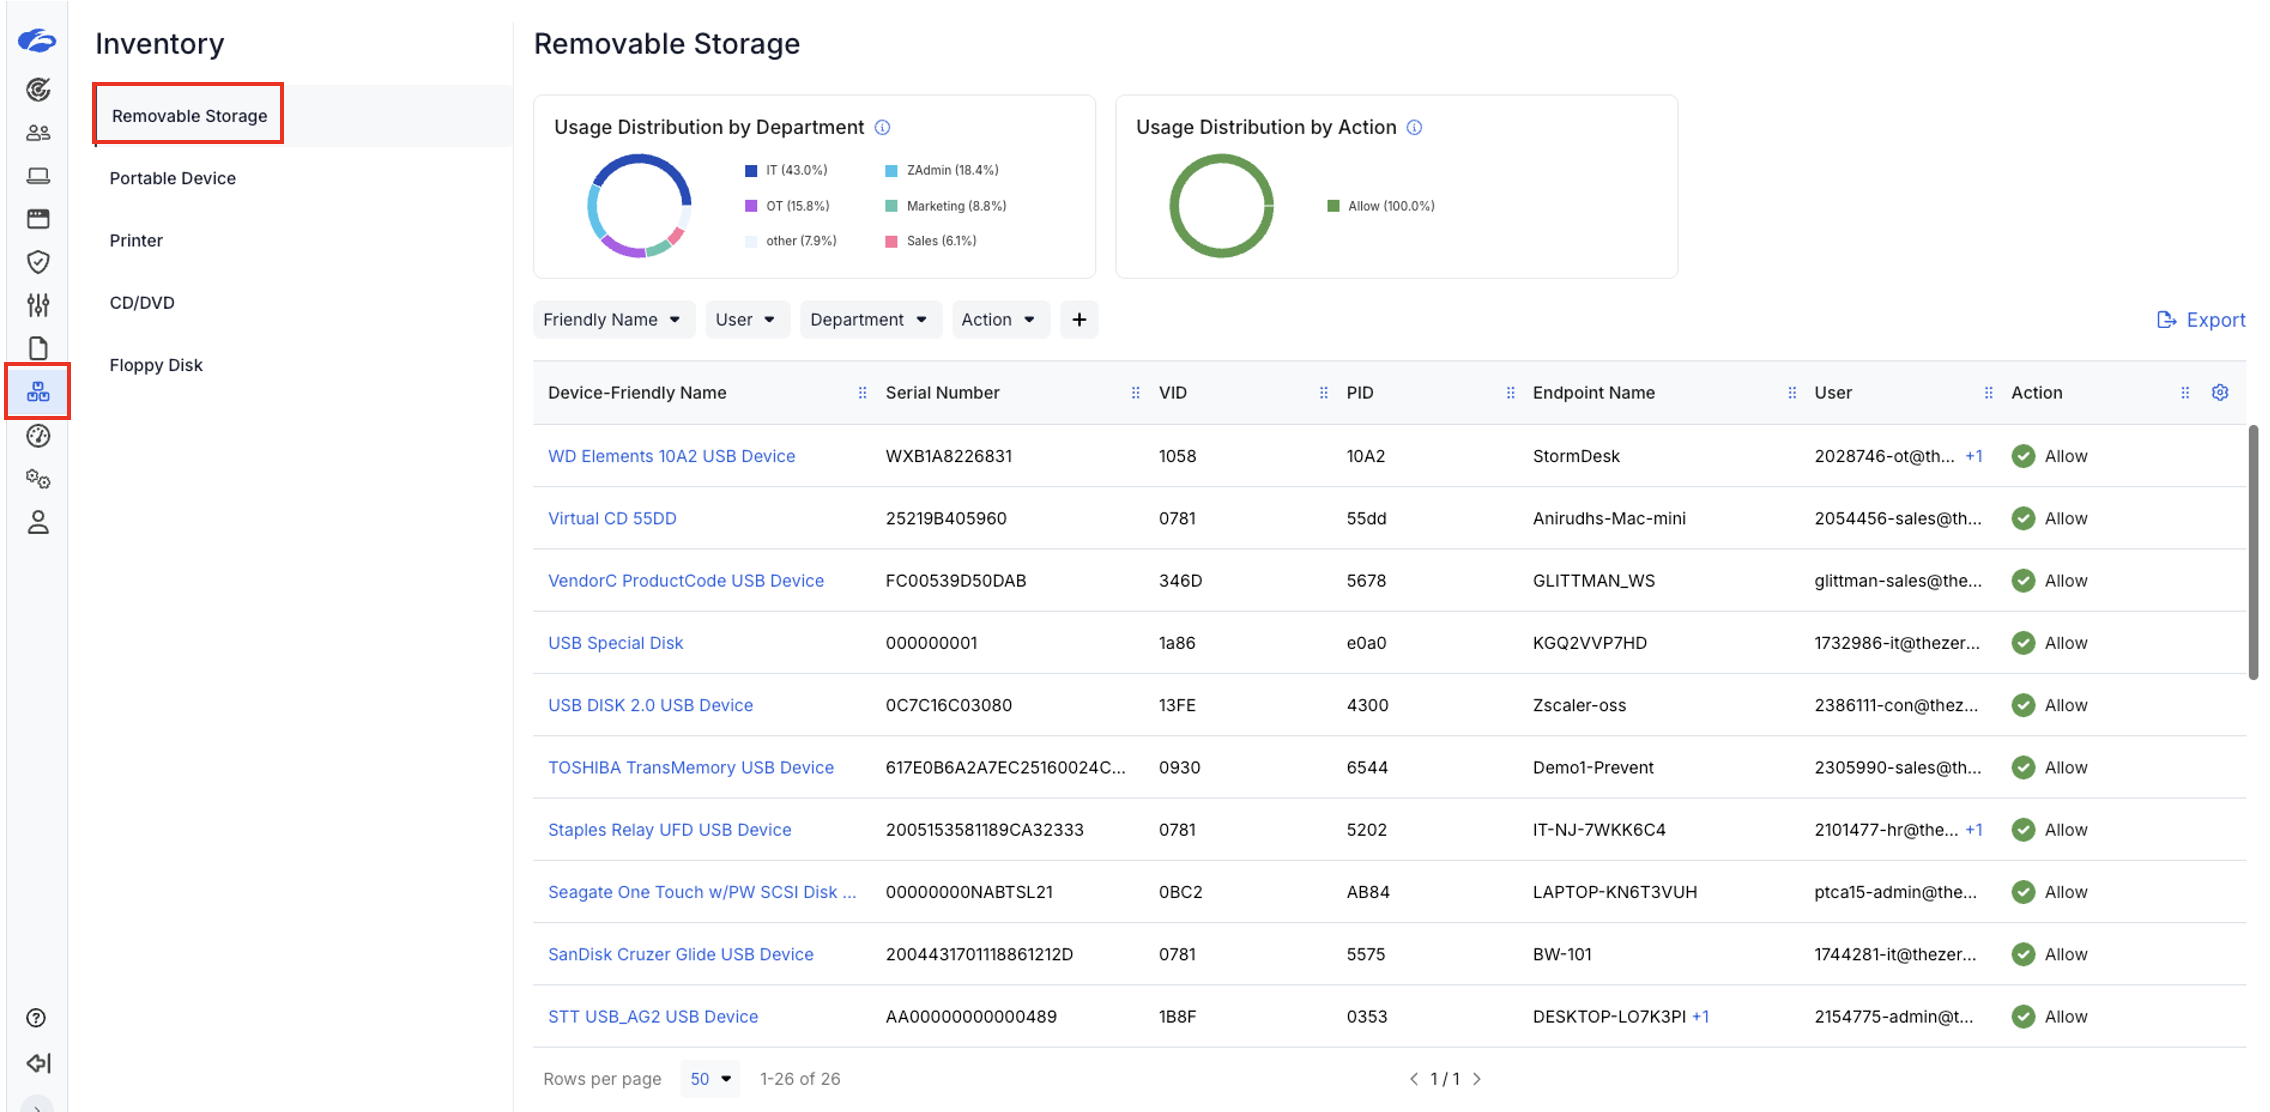
Review Usage Distribution by Department, Usage Distribution by Action, and these device fields:
- Device-Friendly Name, Serial Number, VID, and PID
- Endpoint Name and User
- Action
Use the User filter to explore devices associated with 2305990-sales@thezerotrustlab.com. The screenshot includes a TOSHIBA TransMemory USB Device associated with Demo1-Prevent.
Open linked device names and explore Portable Device, Printer, CD/DVD, and Floppy Disk where available. Inventory shows recorded device associations, not necessarily devices connected right now.
8. Summarise the Complete Endpoint Picture
Questions that you can find answers to:
- How many users and files contain sensitive data?
- Which classifications, departments, and file types appear most often?
- What data and devices are associated with the investigation user?
- What application, channel, destination, rule, and action appear in an incident?
- Which endpoint applications or versions warrant further investigation?
- Which connected-device records can you associate with an endpoint and user?
- What else did you discover through filters, tabs, or drill-downs?
With Endpoint Data Scan and its related views, you gain visibility into sensitive data, endpoint applications, and devices that have been connected. Together with user activity, these views build a complete picture of what is happening on the endpoint.
Keep exploring beyond the steps. Use the available filters, tabs, linked records, and View All options to connect findings across views.
You have completed Lab 3 – Endpoint Data Visibility. Continue to Lab 4 – Microsoft Copilot Readiness.
Understand where sensitive content exists across Microsoft 365 and how existing sharing permissions could increase risk before enabling Microsoft Copilot.
1. Review the Microsoft Copilot Readiness Dashboard
Analytics → SaaS Workflows → Microsoft Copilot Readiness Assessment
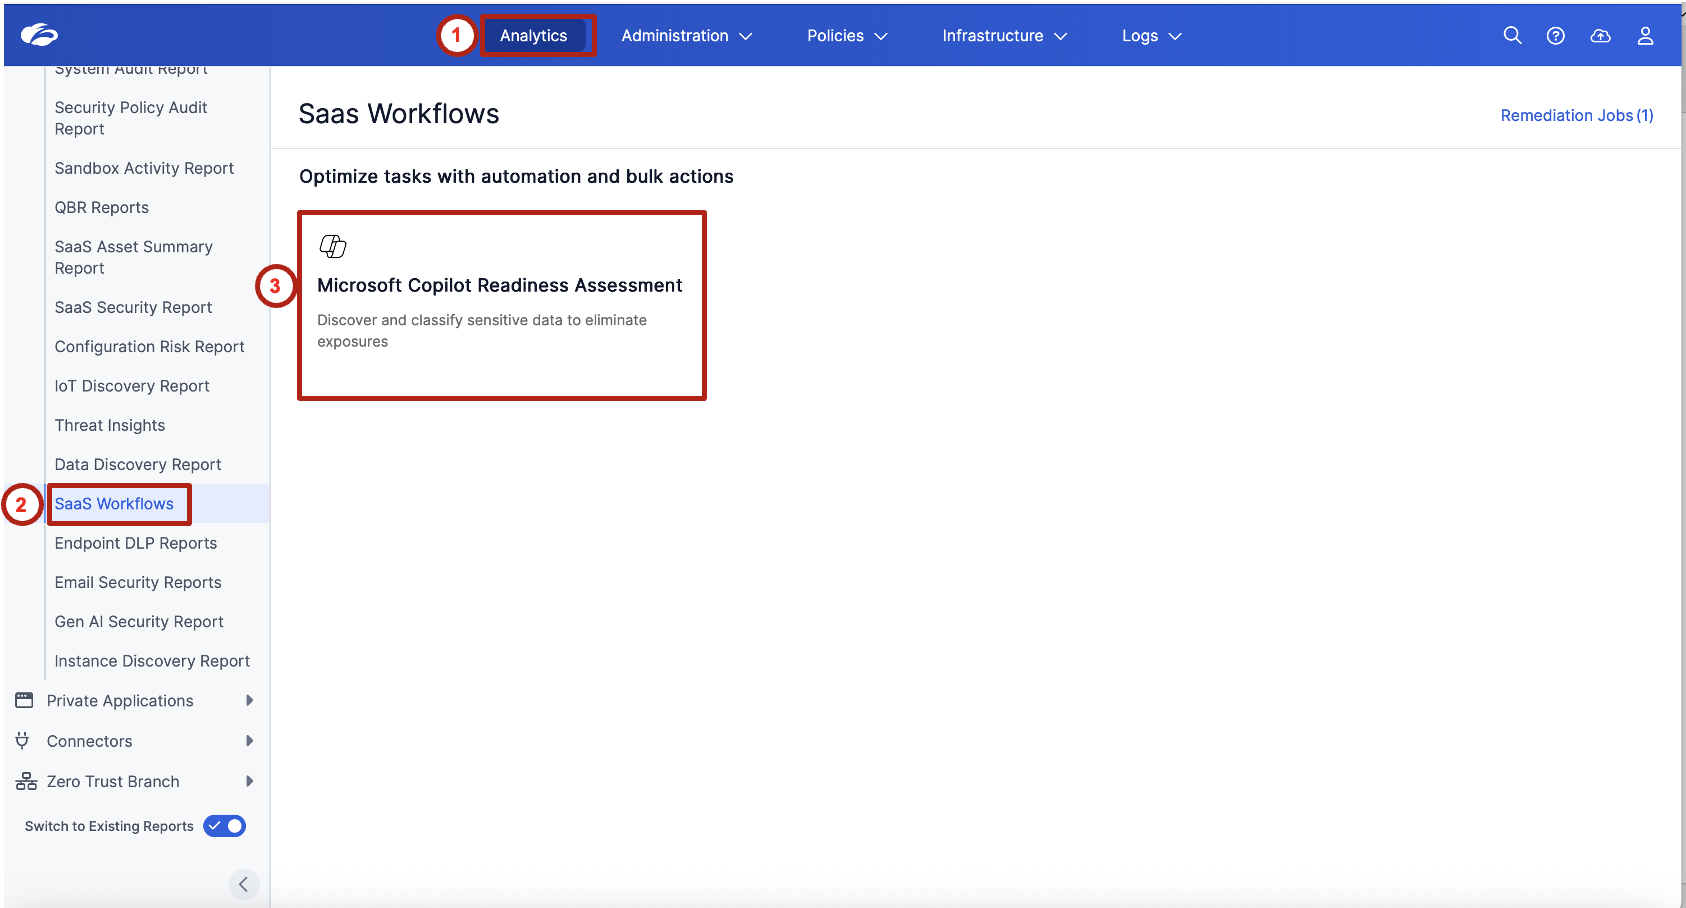
This is a read-only exercise. Review the data exposure posture only — do not modify any settings.
Review the summary tiles at the top of the page. Focus on:
- Total No. of Sensitive Assets
- Sensitive Assets Exposed Org-Wide
- Sensitive Assets Exposed with Specific Users
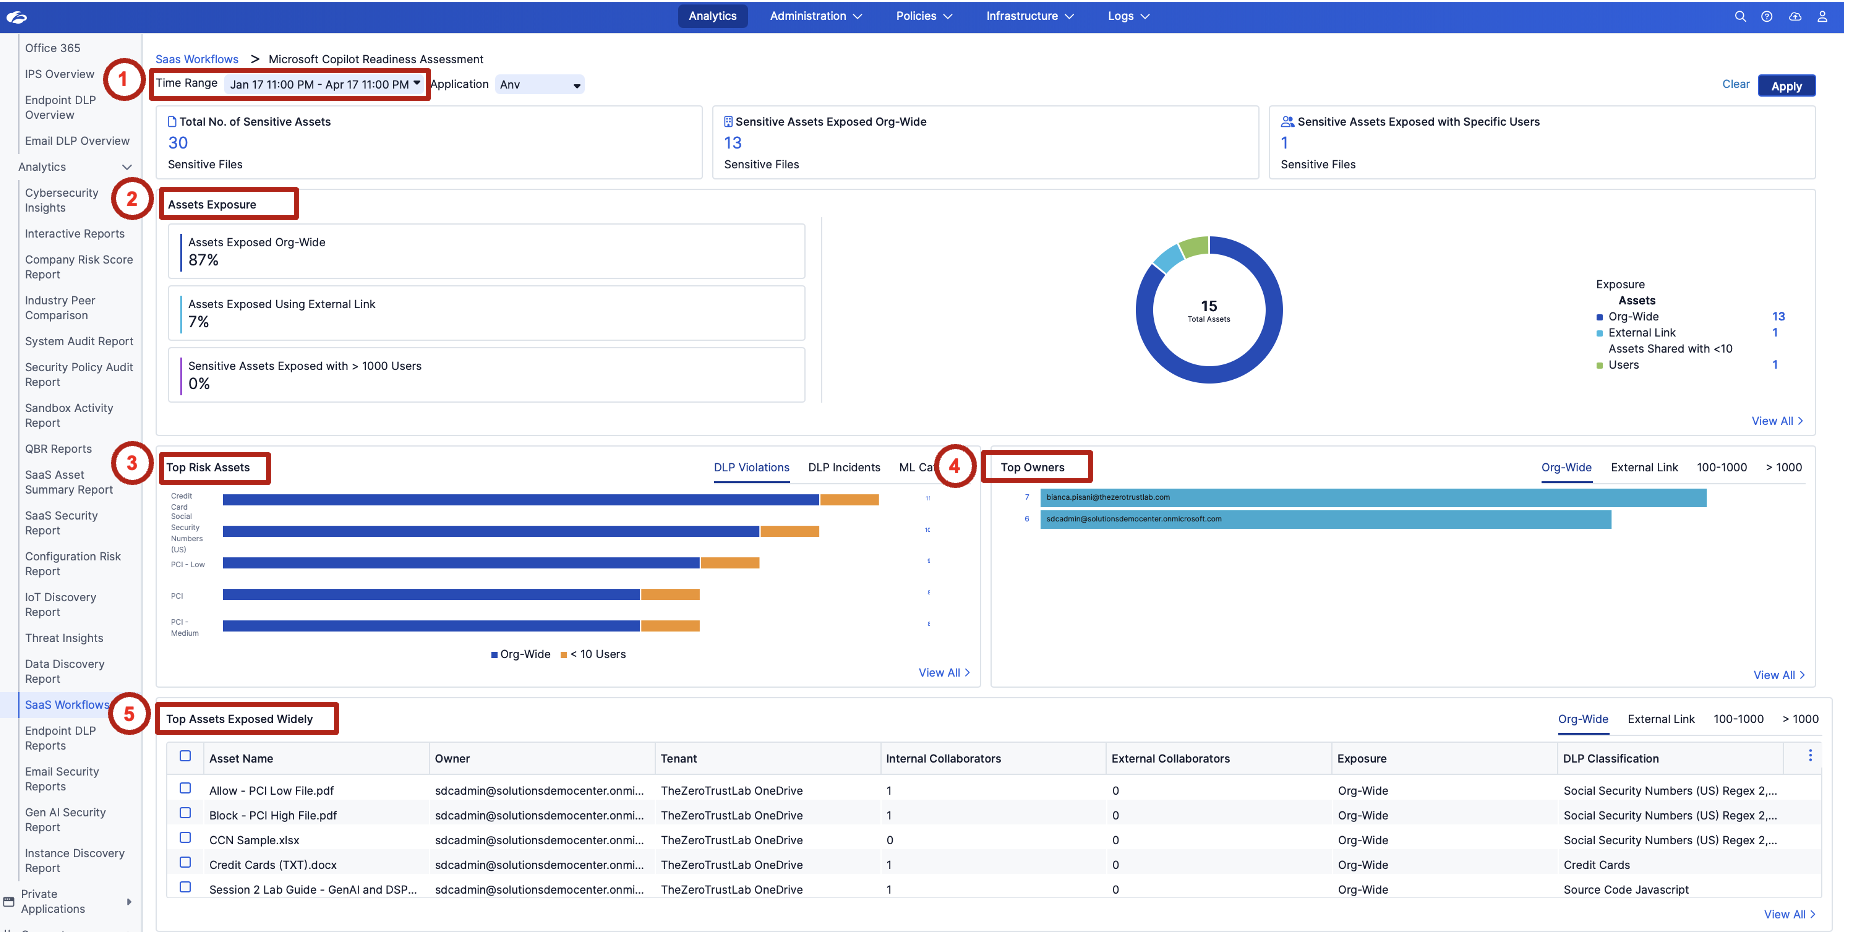
Review the Assets Exposure section. Observe the exposure categories:
- Assets Exposed Org-Wide
- Assets Exposed Using External Link
- Sensitive Assets Exposed with > 1000 Users
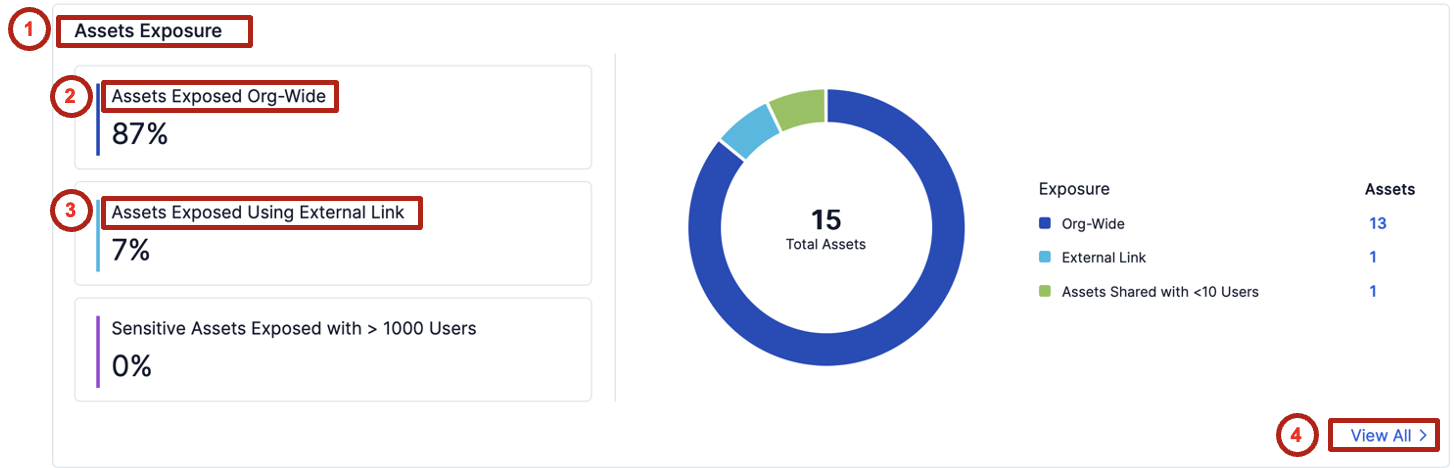
This is the key readiness signal. The broader the sharing, the greater the chance Copilot can retrieve and summarize sensitive content for unintended users.
2. Review All Exposed Sensitive Assets
Identify which specific files are exposed and understand what remediation actions may be needed before enabling Copilot.
In the Assets Exposure section, click View All.
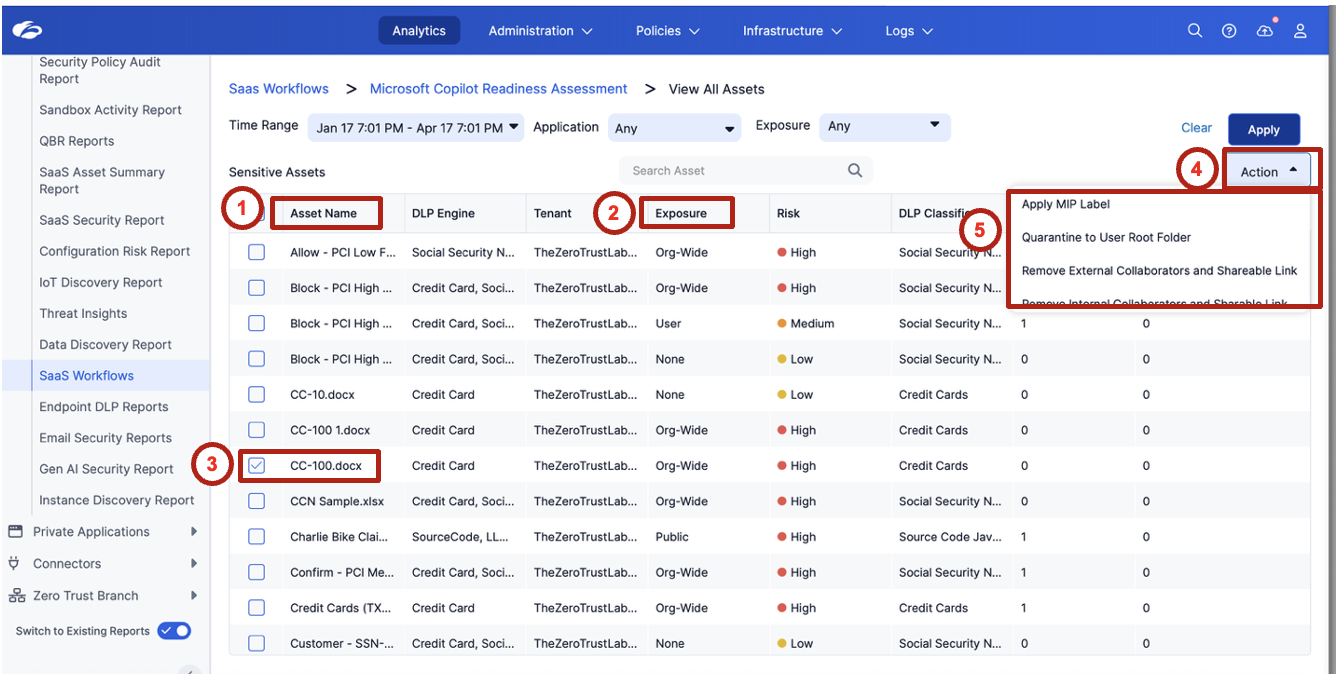
Review the list of exposed sensitive assets. Focus on:
| Field | What to look for |
|---|---|
| Asset Name | Recognizable sensitive filenames (payroll, financial, HR) |
| Owner | Who is responsible for this file |
| Tenant | OneDrive vs. SharePoint |
| Internal Collaborators | How many internal users have access |
| External Collaborators | Any external sharing |
| Exposure | Org-Wide / External Link / Limited |
| DLP Classification | What sensitive data type was detected |
Select one or more assets and review the available remediation options. Example action: Apply MPIP label.
Readiness is not just about visibility. It is about reducing exposure before Copilot is deployed.
Navigate back to the dashboard by clicking Microsoft Copilot Readiness Assessment in the breadcrumb.

3. Investigate Top Risk Assets
Determine which sensitive data types represent the highest potential risk if Copilot is enabled.
In the Top Risk Assets widget, click the data type with the highest count (for example, Credit Card).
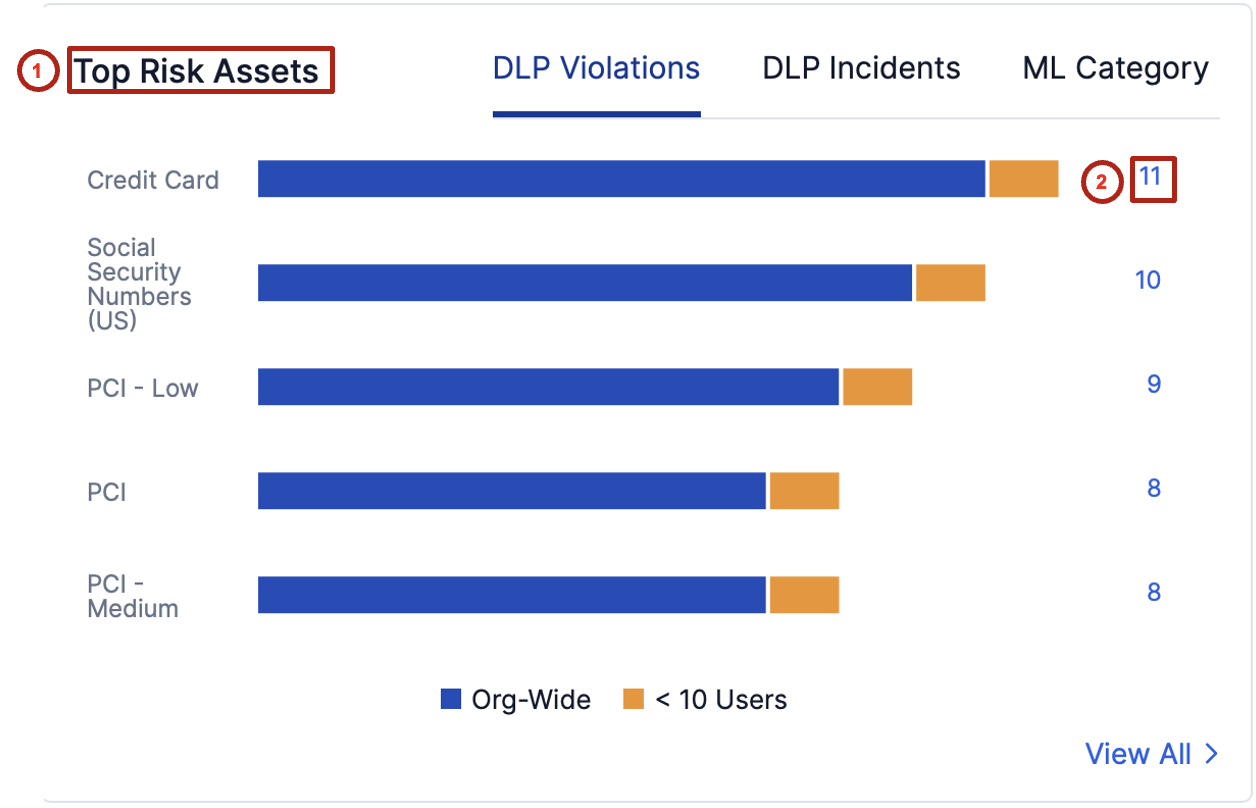
Review the assets associated with that sensitive data category. Identify:
- Where the files are stored (OneDrive or SharePoint)
- Who owns the files
- How the files are shared
- Whether they are exposed Org-Wide, via External Link, or to a limited set of users
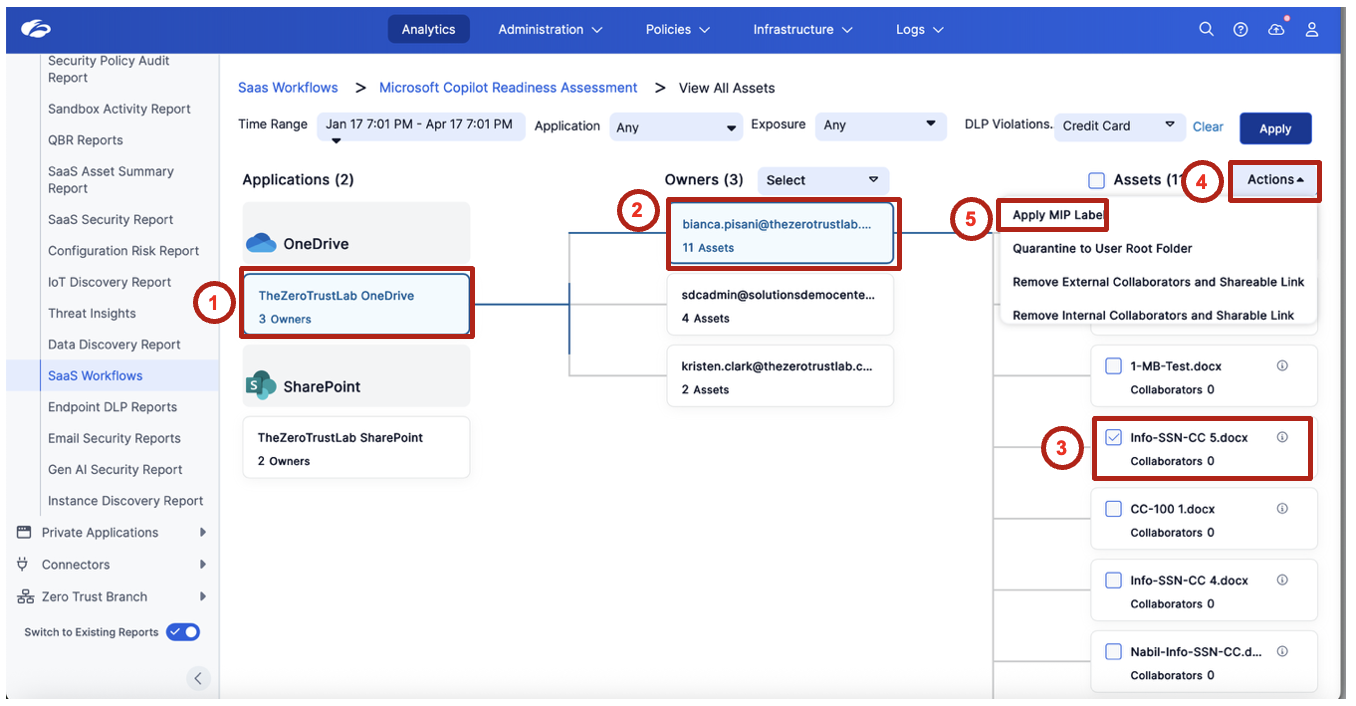
This moves security teams from high-level visibility into actionable investigation — not just "how many sensitive files exist" but "which specific files, owned by whom, shared how."
4. Review Top Owners of Exposed Sensitive Data
Identify which users own the largest amount of broadly exposed sensitive content.
Review the Top Owners widget. Focus on the Org-Wide tab first. Observe which users are associated with the most exposed sensitive assets and consider whether the sharing pattern looks intentional, excessive, or risky.
5. Validate Copilot Readiness Risk
Connect sensitive data exposure to Copilot deployment risk.
Return to the dashboard and summarize the findings:
| Question | Your finding |
|---|---|
| How many sensitive assets were discovered? | |
| How many are exposed org-wide? | |
| Are any exposed through external links? | |
| Which data types appear most often? | |
| Which owners are associated with the highest risk? |
Discuss why this matters before enabling Microsoft Copilot:
- Copilot can index and retrieve content based on the user's existing access
- Broad sharing increases the chance of unintended data exposure
- Sensitive content should be reviewed and remediated before AI rollout
- If Copilot inherits existing permissions, what happens when sensitive files are shared org-wide?
- Which is the bigger risk in your environment: org-wide sharing or external links?
- Should every sensitive asset be relabeled, or should the first focus be on reducing broad access?
- What remediation steps should be completed before enabling Copilot for end users?
Copilot readiness starts with data access hygiene.
Microsoft Copilot will only be as secure as the permissions and sharing posture that already exist in Microsoft 365. Before deploying Copilot, security teams should identify sensitive content, understand how it is shared, and reduce unnecessary exposure.
Complete these steps before starting Lab 5. You will access your lab VM, log into the Lab Tenant admin console, and configure the Zscaler Client Connector forwarding profile and Windows app policy. Allow 15 minutes.
Open Credentials in your assigned CloudShare environment. For Module 2, use the Zscaler Tenant / Student Admin credentials, not the SDC Credentials used in Module 1.
Module 2 (Labs 5–8) runs on the Lab Tenant with a Windows VM and the Zscaler Client Connector. Complete Parts 1–3 below before starting Lab 5.
📌 None of this is needed for Module 1 — the Enterprise Tenant login for Labs 1–4 is covered at the start of Lab 1.
Lab Environment Overview
Your lab environment consists of two components:
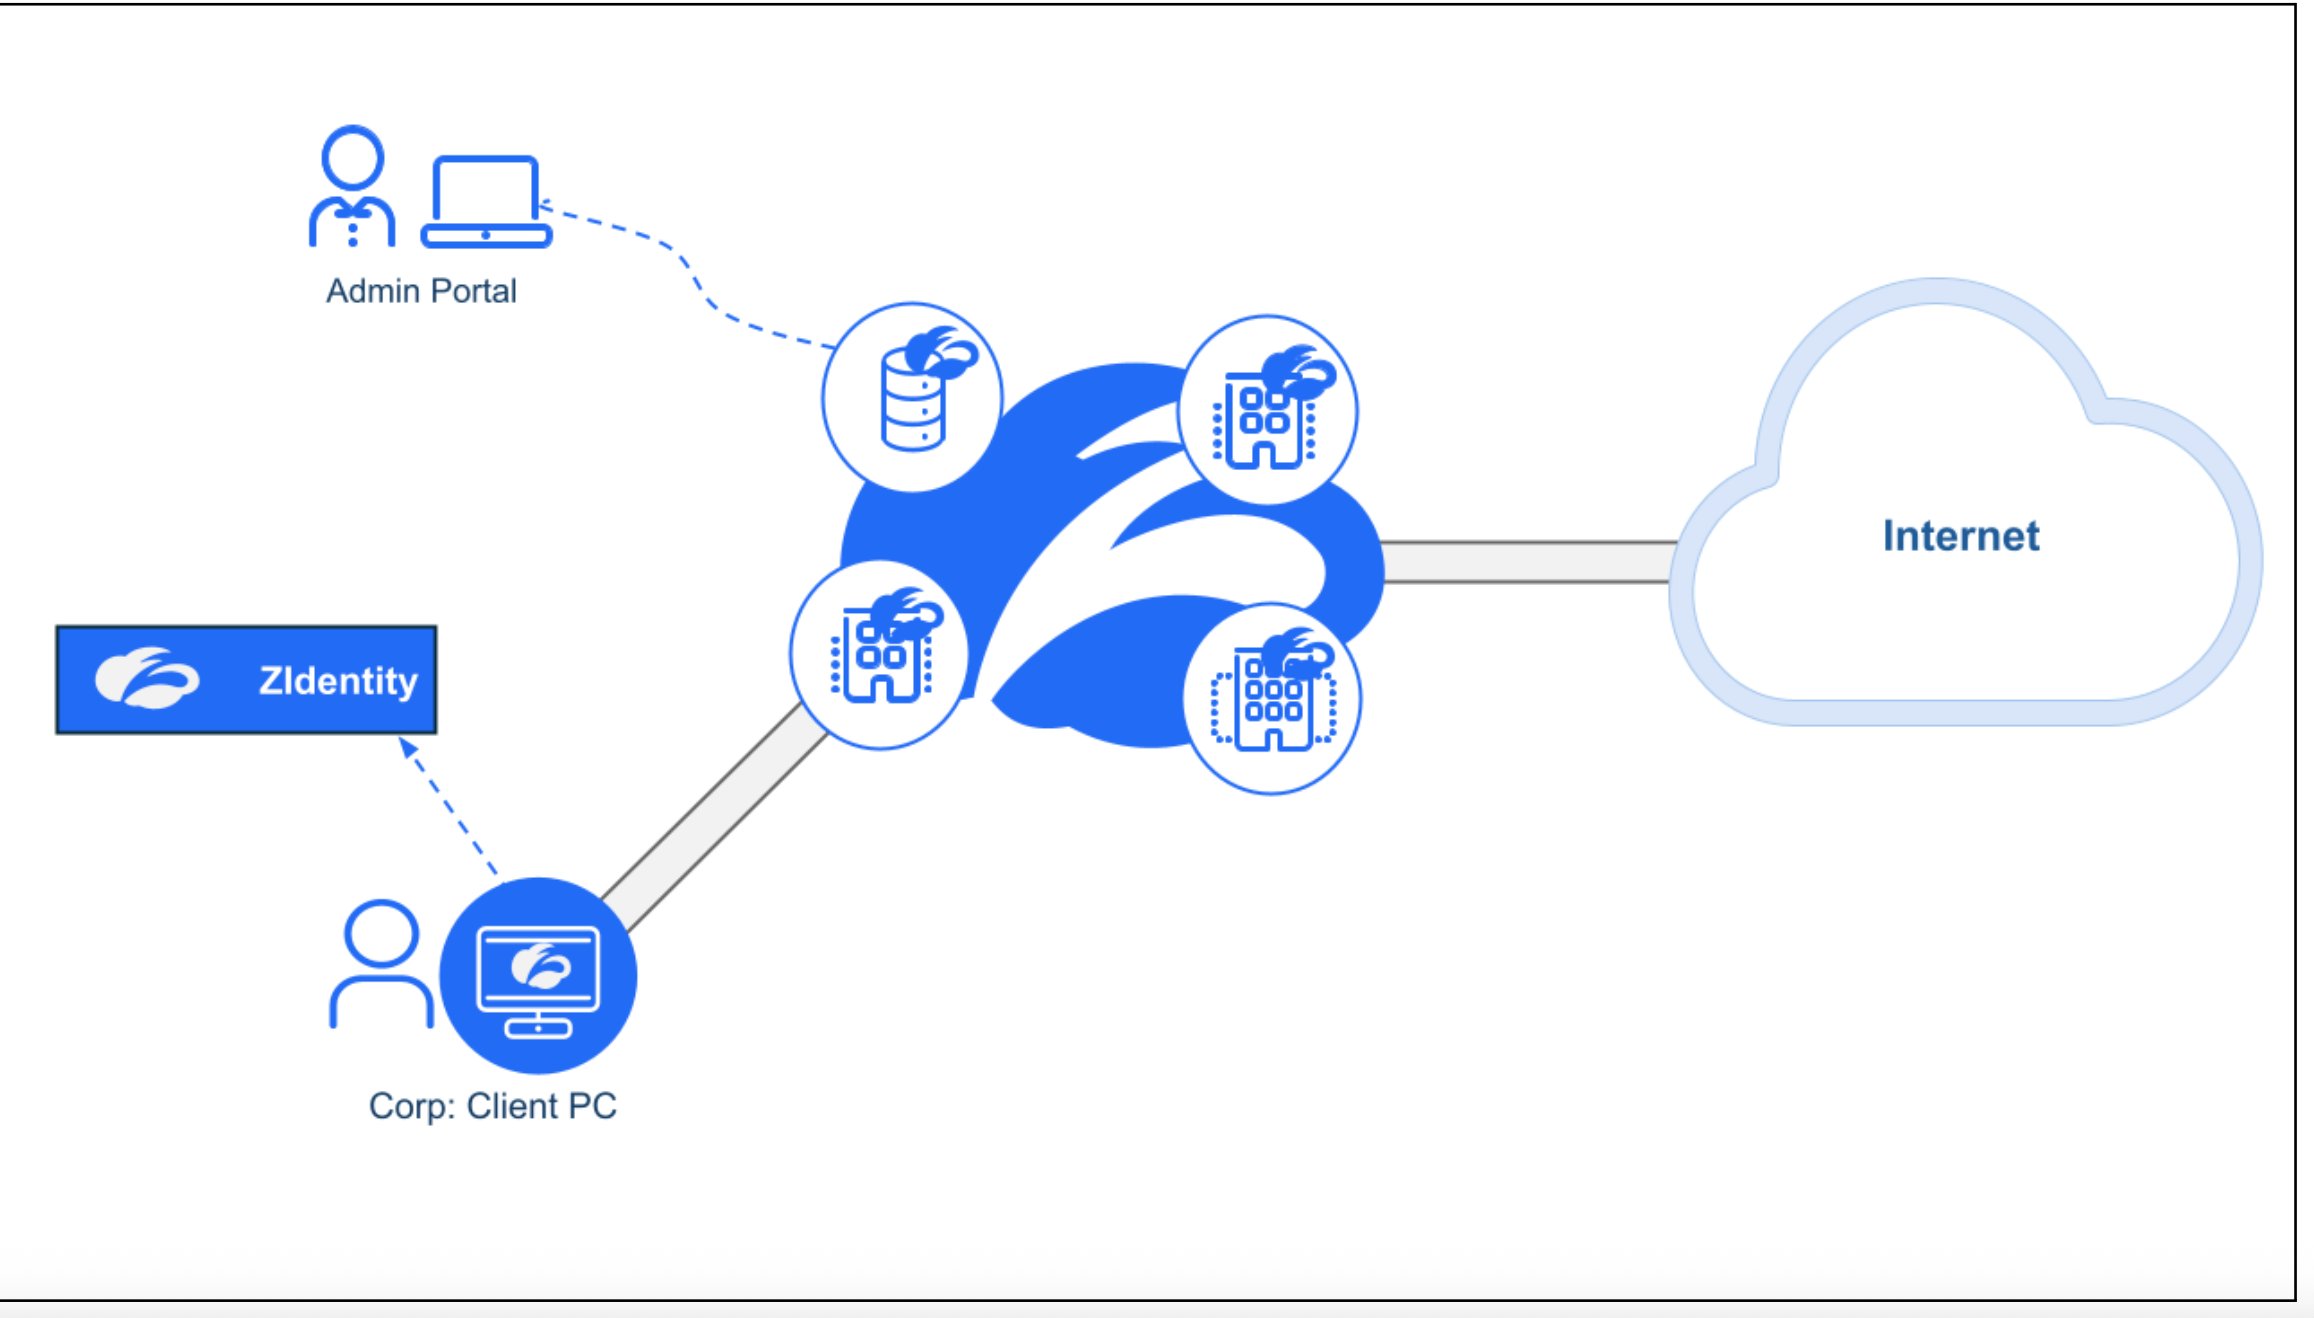
| Component | Description |
|---|---|
| Corp Client PC | A Windows VM in your assigned CloudShare environment. Used for all Kevin (end user) tasks in Labs 6, 7, and 8. |
| Admin Portal | The Zscaler console accessed from your own laptop. Used for all Alex and Priya tasks. |
| Zscaler Cloud | Your traffic and DLP enforcement plane. ZCC on the VM routes all traffic through Zscaler. |
Part 1 — Access Your Lab Environment
Step 1 — Locate Your Lab Tenant Credentials
- Open your assigned CloudShare environment and select Credentials in the left menu.
- Under Zscaler Tenant, locate the Zscaler Admin Console link, Student Admin Username, and One Time Password.
- Use these Student Admin credentials for Module 2, not the SDC Credentials listed below them.
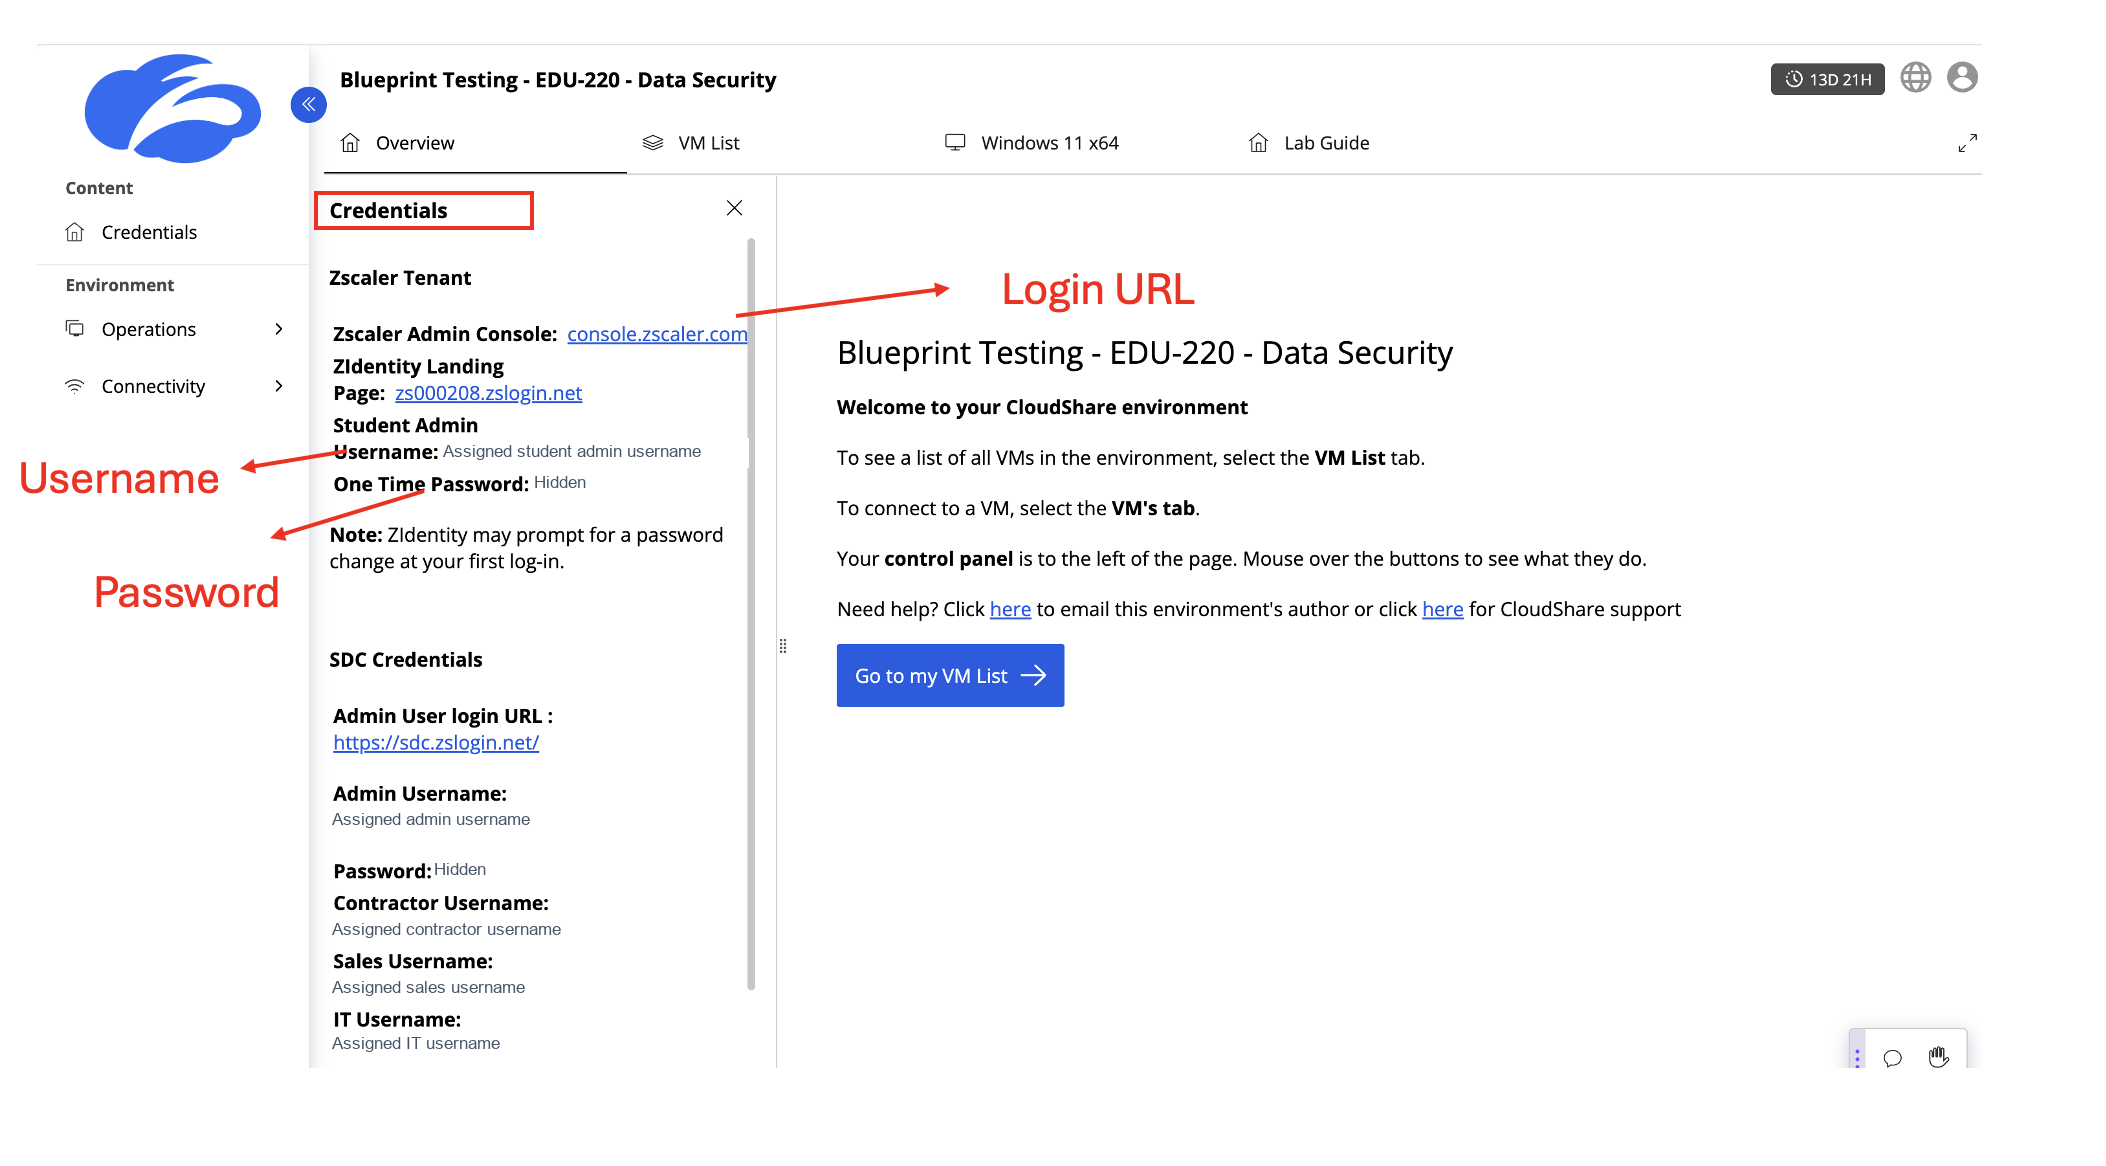
Step 2 — Access the Lab VM
In CloudShare, open the Windows VM tab, shown as Windows 11 x64 in the screenshot. Use VM List to locate the VM if needed.
Verify the VM is ready:
- Zscaler Client Connector icon visible in the system tray
- File
Dataparity_Q2_2025_Workforce_Financial_Summary.docxis on the Desktop
Step 3 — Log Into the Lab Tenant (Module 2)
From your laptop browser, open the Zscaler Admin Console link — console.zscaler.com — and sign in with the Student Admin Username and One Time Password from CloudShare.
If prompted to change the password on first login, set a new password and use it for subsequent admin-console and Client Connector logins.
| Tenant | Used In | Access | Login URL |
|---|---|---|---|
| Enterprise Tenant (SDC) | Modules 1 + 3 | Read-Only | sdc.zslogin.net |
| Lab Tenant | Module 2 only | Read/Write | console.zscaler.com |
The facilitator will indicate when to switch tenants at the start of each module.
Part 2 — Configure Zscaler Client Connector (Lab Tenant)
These steps configure the Client Connector forwarding profile and app policy on the lab VM. This is required for Labs 6, 7, and 8 to enforce DLP policies on endpoint traffic.
All steps in Part 2 are performed in the Lab Tenant admin console. Make sure you are using your Lab Tenant credentials before proceeding.
Step 4 — Log Into the Admin Console
If you are not already logged in from Part 1, go to https://console.zscaler.com from your laptop browser and log in with your Student Admin credentials.
Step 5 — Verify SSL Inspection
- In the Lab Tenant admin console, search for
ssl. - Select SSL/TLS Inspection Policy under Policies, as shown below.
- Confirm that SSL inspection is enabled for the lab traffic. The screenshot shows an Enable SSL rule with Criteria: Any and Action: Inspect. Check that the applicable rule uses Inspect, taking rule order and existing exemptions into account.
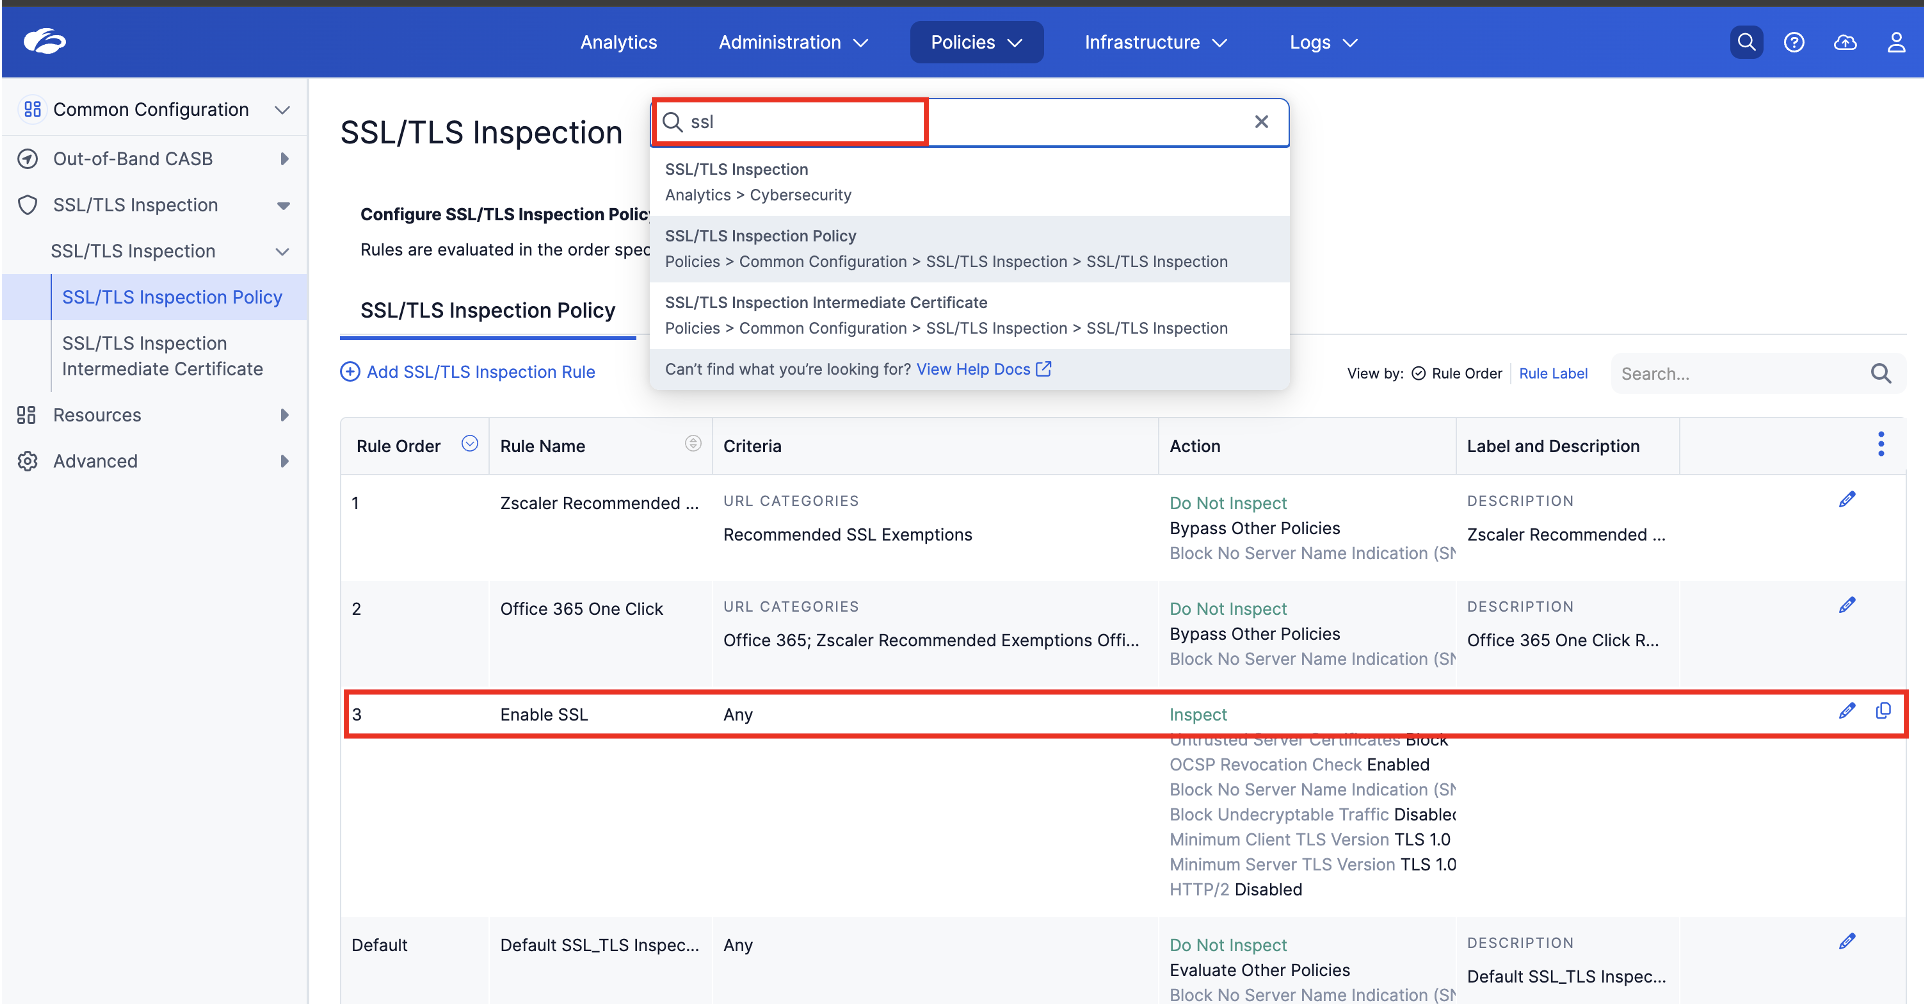
SSL inspection must be enabled for the lab's HTTPS traffic so that inline DLP can inspect its content. Without it, the traffic will not be inspected as expected and the DLP tests may not produce the expected results. If the inspection rule is missing or not applicable, check with your facilitator before continuing.
Step 6 — Navigate to Forwarding Profiles
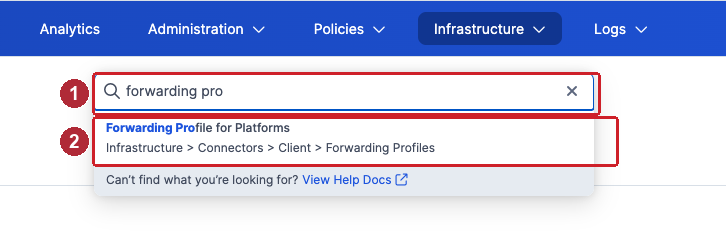
Click the search bar at the top of the admin console and type forwarding profile (1). Select Forwarding Profile for Platforms from the results (2):
Step 7 — Add Forwarding Profile
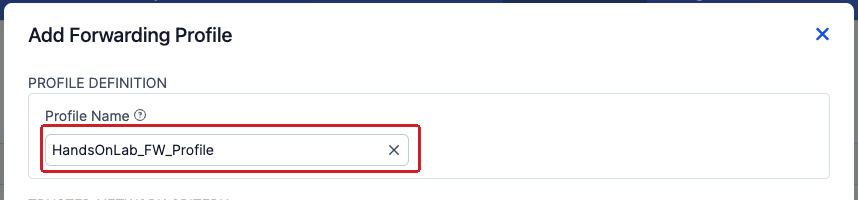
Click Add Forwarding Profile and configure:
- Profile Name:
HandsOnLab_FW_Profile
Step 8 — Configure Windows Driver and ZIA Tunnel Settings
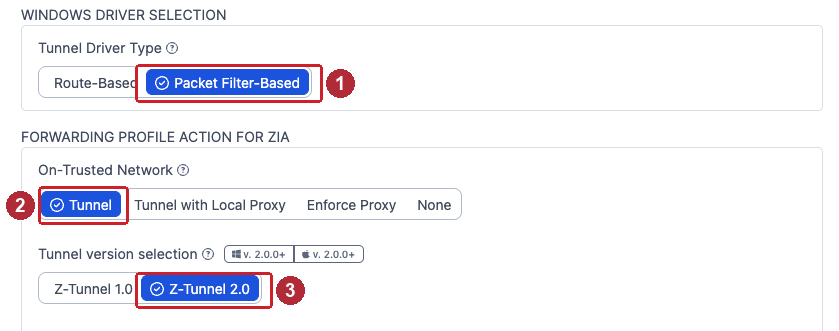
In the WINDOWS DRIVER SELECTION section, then the FORWARDING PROFILE ACTION FOR ZIA section:
- Tunnel Driver Type: Packet Filter-Based (1)
- On-Trusted Network: Tunnel (2)
- Tunnel version selection: Z-Tunnel 2.0 (3)
Step 9 — Configure VPN, Off-Trusted Network, and ZPA
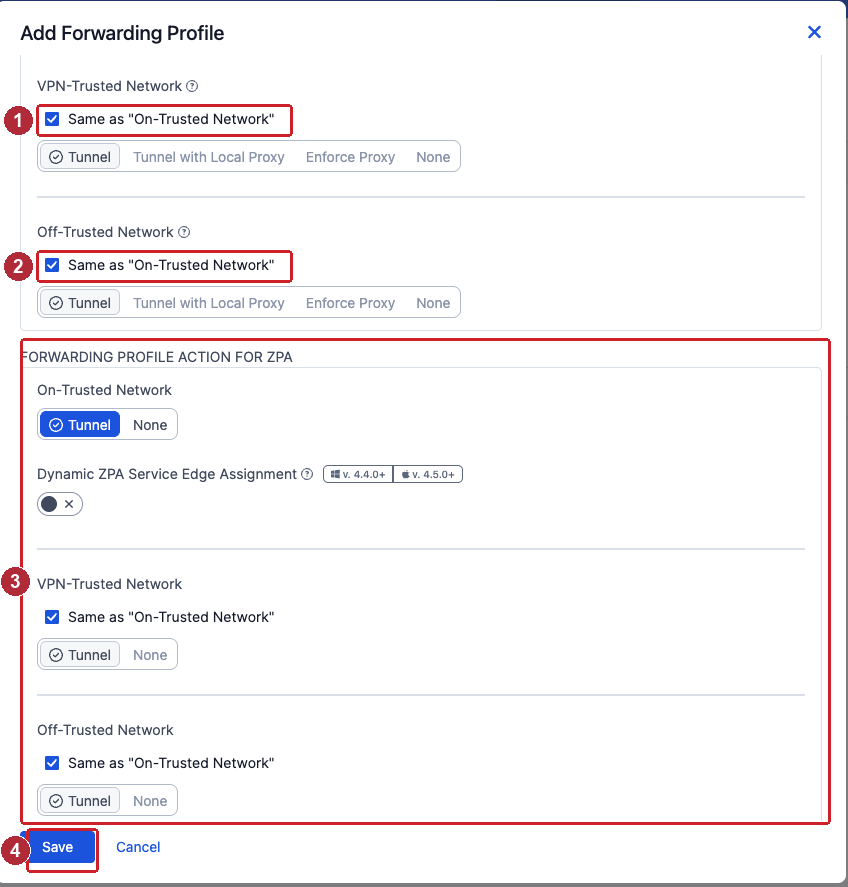
Still in the ZIA section, tick the checkboxes:
- VPN-Trusted Network: Check Same as "On-Trusted Network" (1)
- Off-Trusted Network: Check Same as "On-Trusted Network" (2)
Then, in the FORWARDING PROFILE ACTION FOR ZPA section (3):
- On-Trusted Network: Tunnel
- VPN-Trusted Network: Same as "On-Trusted Network"
- Off-Trusted Network: Same as "On-Trusted Network"
Click Save (4).
Step 10 — Navigate to Windows Platform Settings
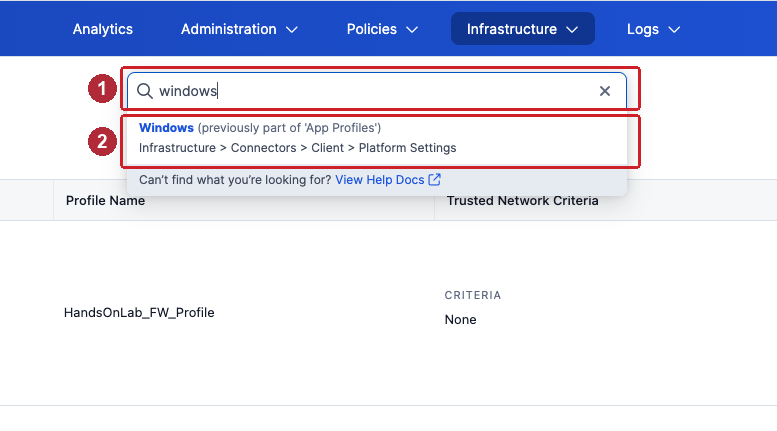
Click the search bar and type windows (1). Select Windows (previously part of 'App Profiles') from the results (2):
Step 11 — Add Windows App Policy
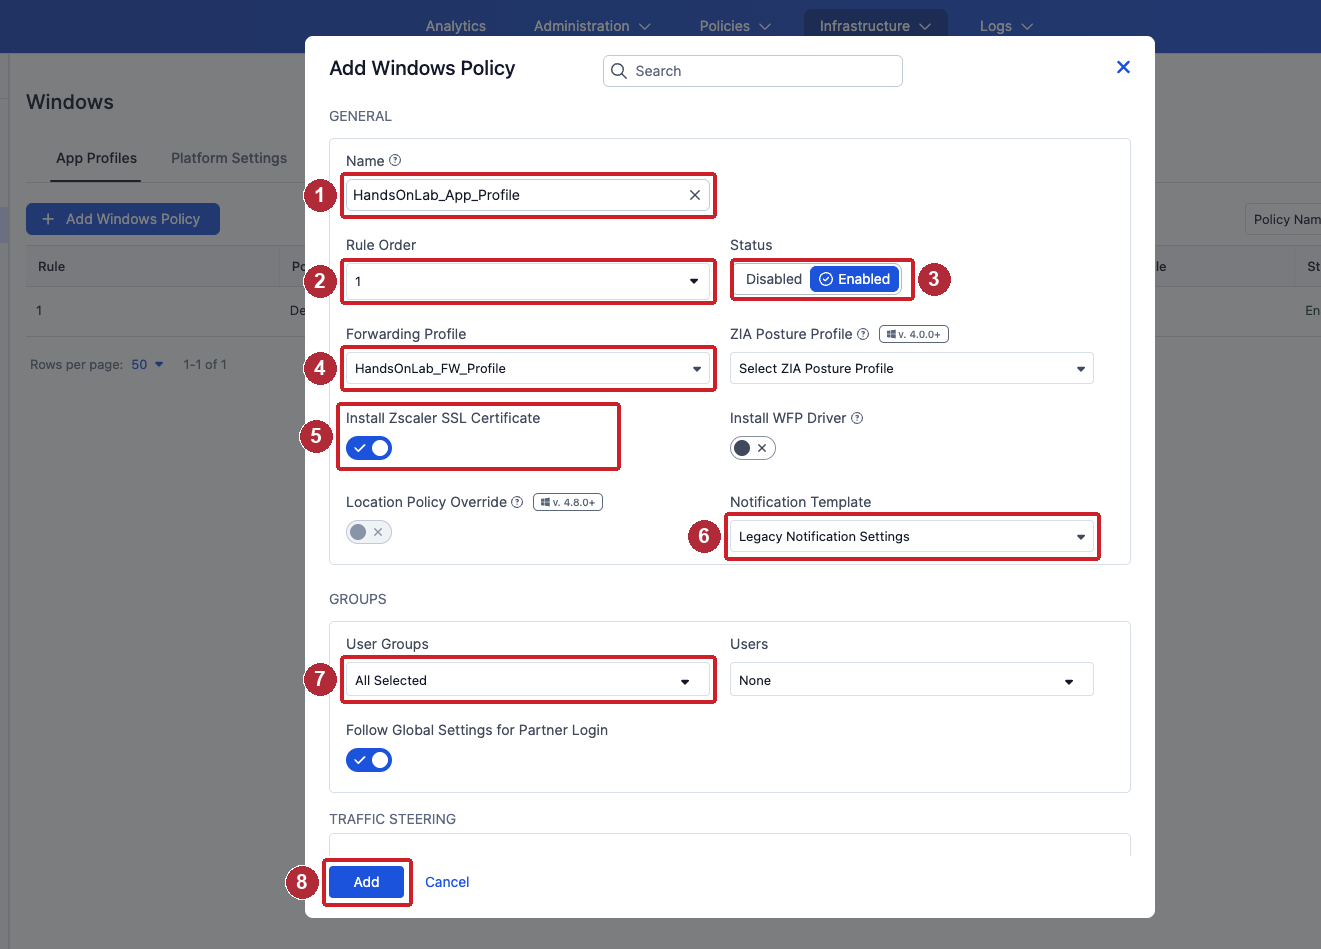
Click + Add Windows Policy and configure:
- Name:
HandsOnLab_App_Profile(1) - Rule Order: 1 (2)
- Status: Enabled (3)
- Forwarding Profile:
HandsOnLab_FW_Profile(4) - Install Zscaler SSL Certificate: On (5)
- Notification Template: Legacy Notification Settings (6)
- User Groups: All Selected (7)
Leave all other settings at their defaults. Don't click Add (8) yet — first complete Step 12 in the same dialog.
Step 12 — Enable Data Protection / Endpoint DLP
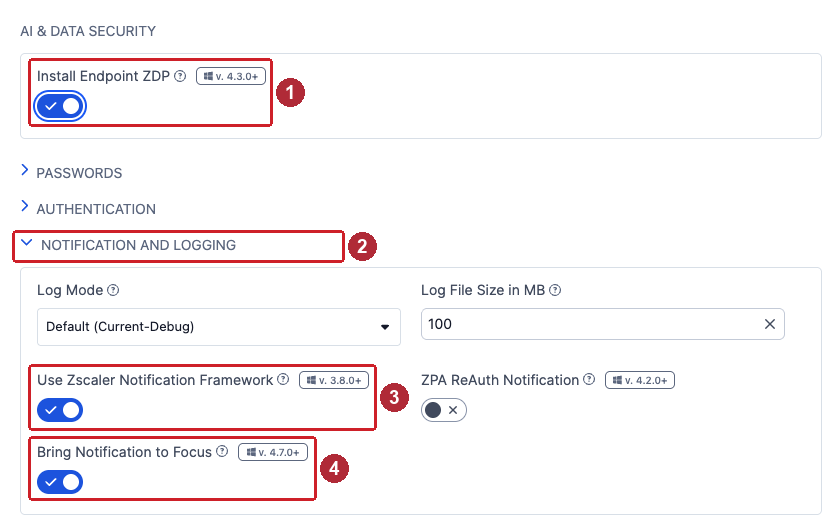
Scroll down in the same Add Windows Policy dialog:
- In the AI & DATA SECURITY section — Install Endpoint ZDP: On (1)
- Expand NOTIFICATION AND LOGGING (2):
- Use Zscaler Notification Framework: On (3)
- Bring Notification to Focus: On (4)
Then click Add to save the policy.
Part 3 — Setup VM and Login to Zscaler Client Connector (ZCC)
Step 1 — Login to the VM
Return to the Windows VM tab in your assigned CloudShare environment. If a Windows sign-in is required, use the VM credentials supplied for your environment.
Step 2 — Open and Login to Zscaler Client Connector
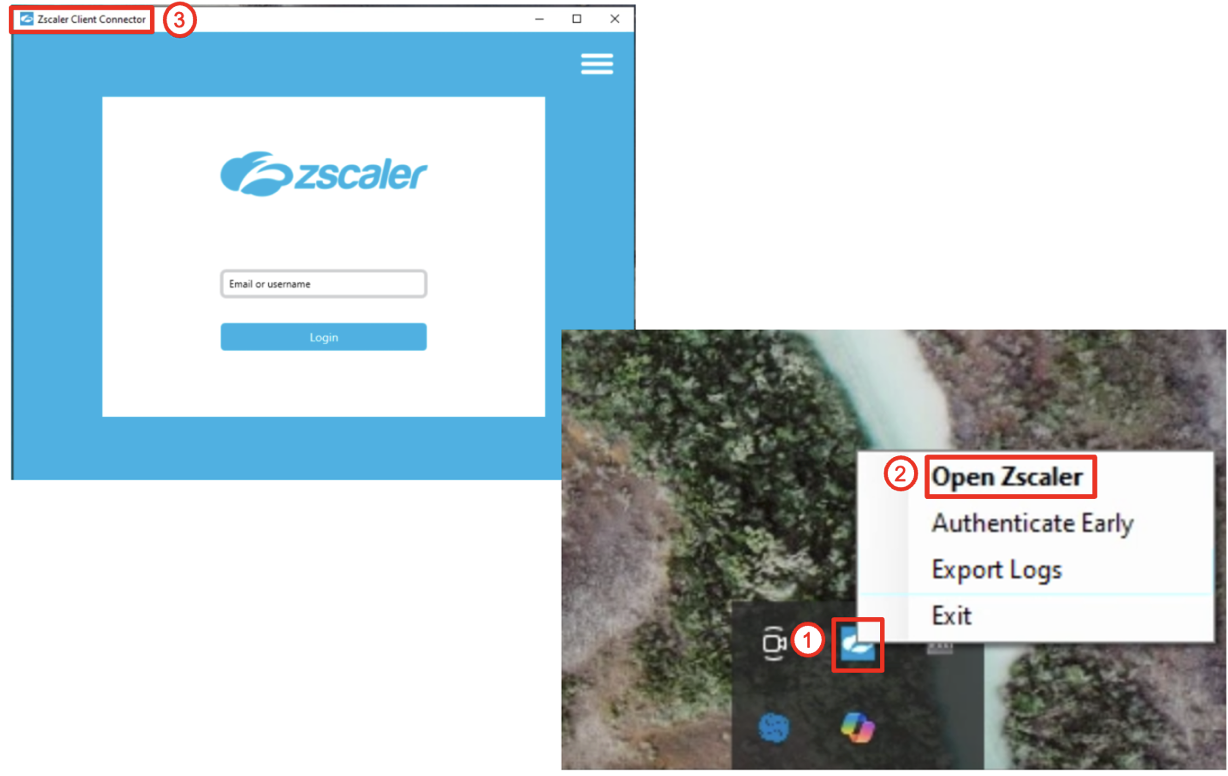
Locate the ZCC icon in the system tray (bottom right of the taskbar) ①, right-click it, and select Open Zscaler ②. The Zscaler Client Connector window opens ③.
Use your Lab Tenant Student Admin username from Part 1, Step 3 and its current password to log in. If you changed the one-time password, use your updated password here.
Tip — Copy/Paste: If direct paste does not work, use the clipboard controls available in your VM console, or enter the credentials manually.
Step 3 — Verify All Modules Are Active
Once logged in, the ZCC dashboard opens. Confirm the following:
- Authentication Status: Authenticated (green)
- Service Status: ON
- All modules (Private Access, Internet Security, Digital Experience, Data Protection) are visible and active
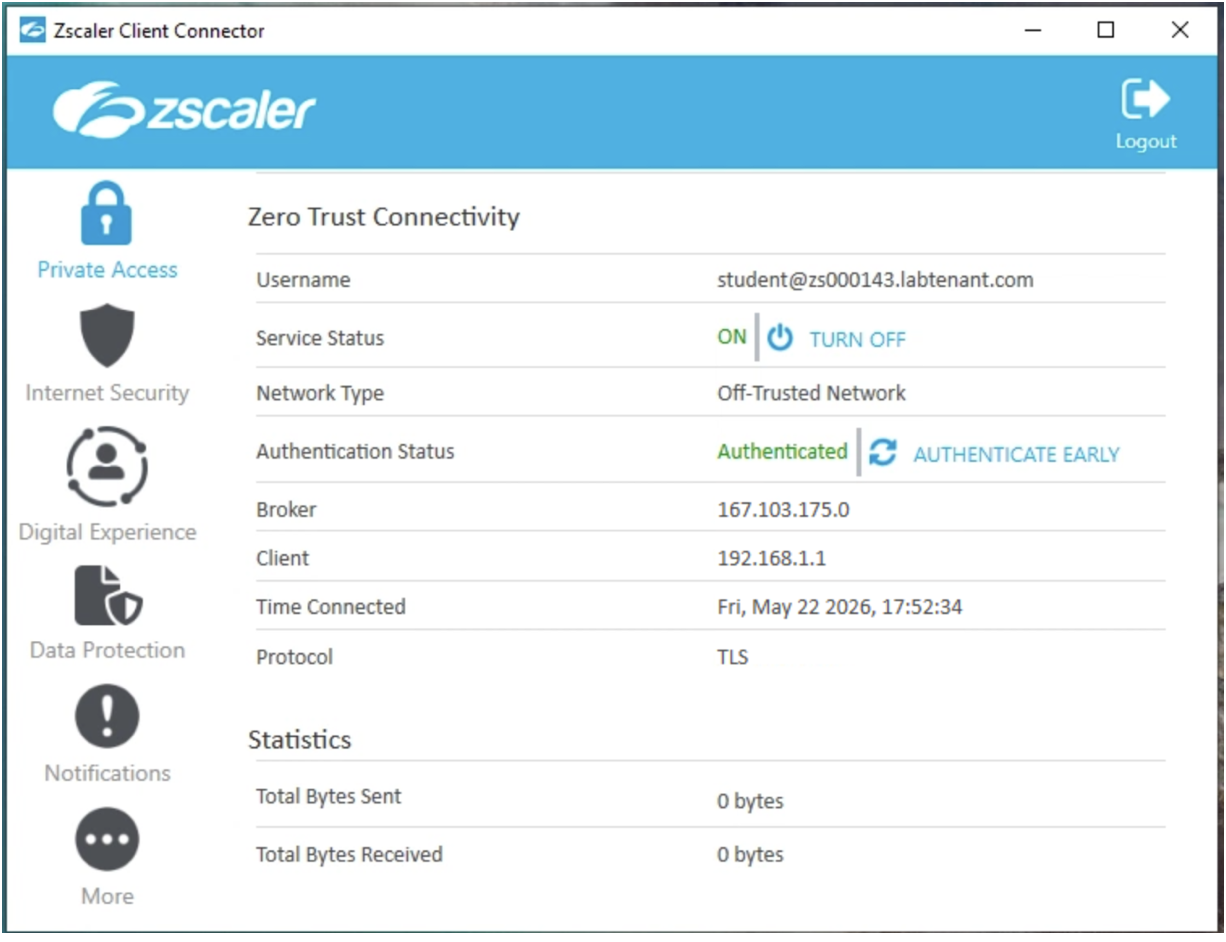
Step 4 — Verify Traffic Is Being Steered to Zscaler
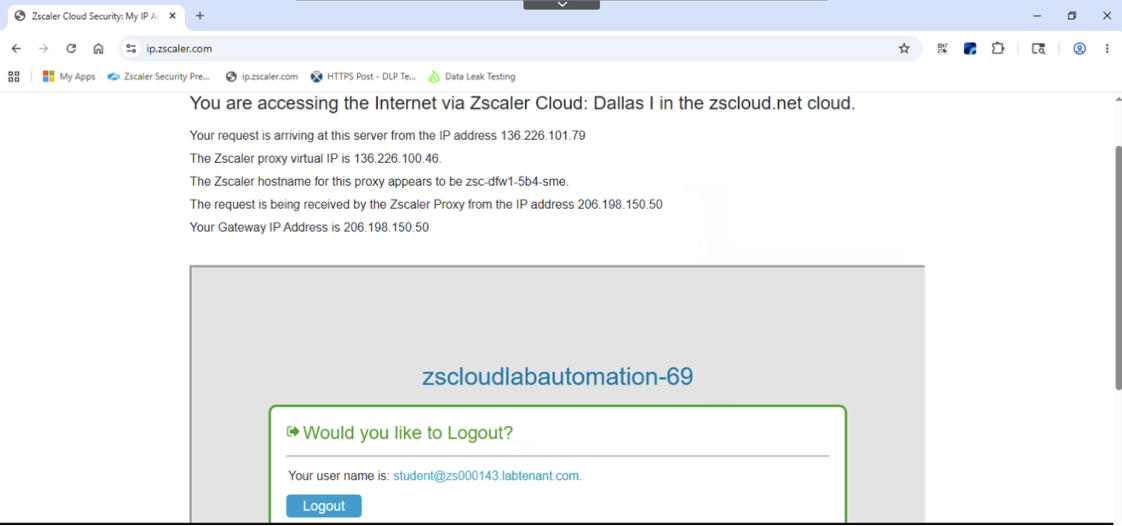
Open a browser inside the VM and navigate to https://ip.zscaler.com. The page should confirm your traffic is passing through the Zscaler Zero Trust Exchange and display your Zscaler proxy details.
Notepad++ is pre-installed on the VM — no installation needed. It is ready to use for Lab 7.
Quick Reference — All Credentials
| What | URL / Access | Username | Password |
|---|---|---|---|
| Enterprise Tenant (Admin) | https://sdc.zslogin.net/ | CloudShare → Credentials → SDC Credentials → Admin Username | Password in SDC Credentials |
| Lab Tenant | https://console.zscaler.com | CloudShare → Credentials → Zscaler Tenant → Student Admin Username | One Time Password for initial login; updated password after changing it |
| Browser DLP Extension (Lab 8) | https://enterprise.onsqrx.com/ → tenant: dlpdemo | SDC Admin Username from CloudShare | SDC Admin password |
| Lab VM | Windows VM tab in CloudShare | VM credentials supplied for your environment, if requested | VM credentials supplied for your environment, if requested |
| Zscaler Client Connector (VM) | N/A | Same as Lab Tenant Student Admin username | Current Lab Tenant password |
Tenant identifiers and usernames may differ from the screenshots. Use the credentials in your assigned CloudShare environment.
Module 2 Overview
Alex moves from visibility to protection: build detection logic in Lab 5, configure and test Inline Web and Endpoint DLP in Labs 6–7, then test preconfigured Browser DLP controls in Lab 8 as Kevin. The DP Project Code engine combines Credit Cards AND ABA Bank Routing Number AND the custom DP Project Code dictionary; Labs 6 and 7 reuse it. Lab 8 uses separate preconfigured policies for masking, sensitive-download blocking, and watermarking.
Confirm Tenant Switch
Use CloudShare → Credentials → Zscaler Tenant / Student Admin to log into the Lab Tenant (Tenant 2). Complete Pre-Requisites for Module 2 before Lab 5: allow 15 minutes for VM and Client Connector setup, including verification that SSL/TLS inspection applies to the lab HTTPS traffic. Labs 5–7 build detection and enforcement policies; Lab 8 uses preconfigured browser policies and its separate extension login.
Module Objectives
| Question | Capability |
|---|---|
| What defines sensitive data? | DLP Dictionaries |
| How is sensitive data detected? | DLP Engines |
| How is data protected during network transfer? | Inline Web DLP |
| How are file reads and pastes controlled on the device? | Endpoint DLP — Application File Access & Clipboard |
| How do browser controls mask text, block sensitive downloads, and watermark a document view? | Preconfigured Browser DLP |
Labs in This Module
Module 2 requires the Lab Tenant and a configured Zscaler Client Connector on the VM. Before proceeding, go to Pre-Requisites for Module 2 and complete:
- Part 1 — Access Your Lab Environment
- Part 2 — Configure Zscaler Client Connector (Lab Tenant), including Step 5: verify that SSL inspection uses Inspect for the lab's HTTPS traffic
- Part 3 — Setup VM and Login to ZCC
📌 Once ZCC is authenticated, its service is ON, all modules are active, and ip.zscaler.com confirms your traffic is tunneled — come back here and start Lab 5.
Dependency: The DLP engine created in this lab combines the custom dictionary with two predefined dictionaries and is referenced in Labs 6 and 7. Lab 8 uses preconfigured browser policies, not this engine. Complete all steps before moving to the next lab.
Build a custom dictionary and a DLP engine for the Web and Endpoint protection policies in Labs 6 and 7.
Step 1: Navigate to DLP Dictionaries and Review Predefined Dictionaries
Policies → Data Protection → Common Resources → Dictionaries & Engines
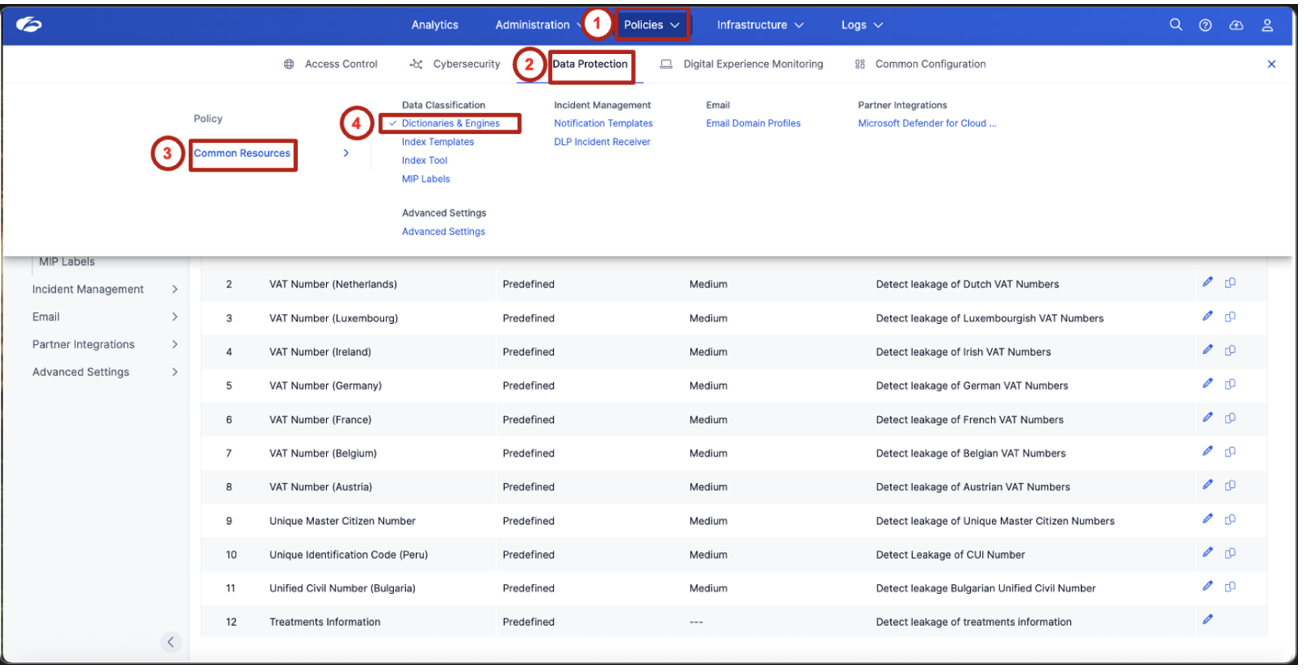
Review the list of predefined dictionaries. Locate and observe the following two dictionaries used in this lab:
- Credit Cards
- ABA Bank Routing Number
These predefined dictionaries require no changes — you will add them directly to the DLP engine in Step 3.
These predefined dictionaries provide built-in detection capabilities for commonly regulated data types — no configuration required to get started with standard compliance frameworks.
Step 2: Create a Custom DLP Dictionary
Build custom detection logic for organization-specific sensitive data.
Click Add DLP Dictionary and configure with the following settings.
| Field | Value |
|---|---|
| Name | DP Project Code |
| Dictionary Type | Patterns & Phrases |
| Match Type | Match Any |
| Enable Proximity | Enabled |
| Proximity Length | 200 |
Add the following detection patterns:
Set the action to Count Unique.
Then add the following contextual phrases:
- Confidential
- Internal Only
- Salary
- Payroll
- Project Codes
- Internal
Set the phrases' action to Count All, then click Save to save the custom dictionary.
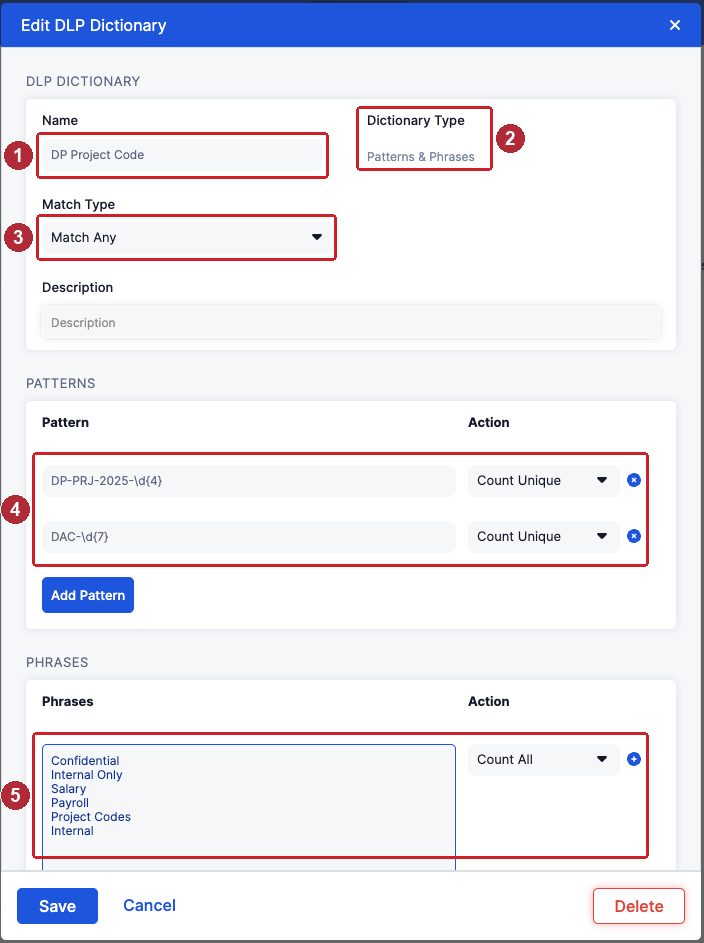
Custom dictionaries allow organizations to detect proprietary identifiers that are not covered by standard compliance templates — project codes, internal classifications, or domain-specific terminology unique to your business.
Step 3: Create a Detection Logic using a DLP Engine
Combine multiple detection signals into a single classification rule.
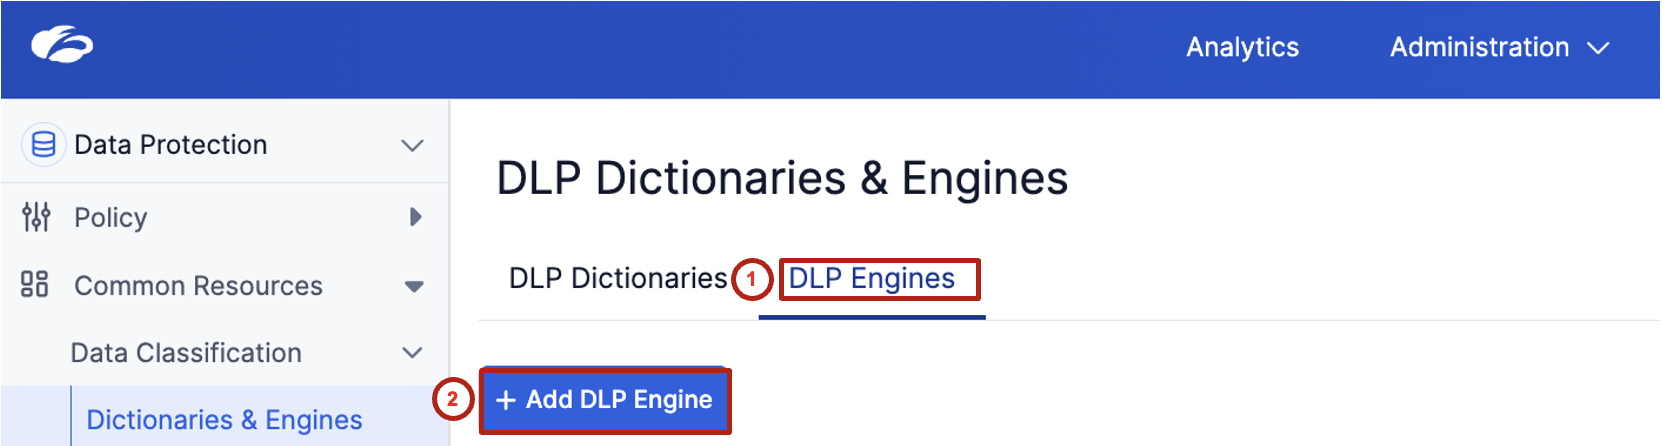
Switch to the DLP Engines tab, then click + Add DLP Engine.
| Field | Value |
|---|---|
| Name | DP Project Code |
| Operator | ALL |
Under Channels, select the following (leave DSPM unchecked):
- Endpoint DLP
- Inline Web
- SaaS Security
- Outbound Email DLP
Then add the following detection components, each with condition > 0:
- Credit Cards
- ABA Bank Routing Number
- DP Project Code
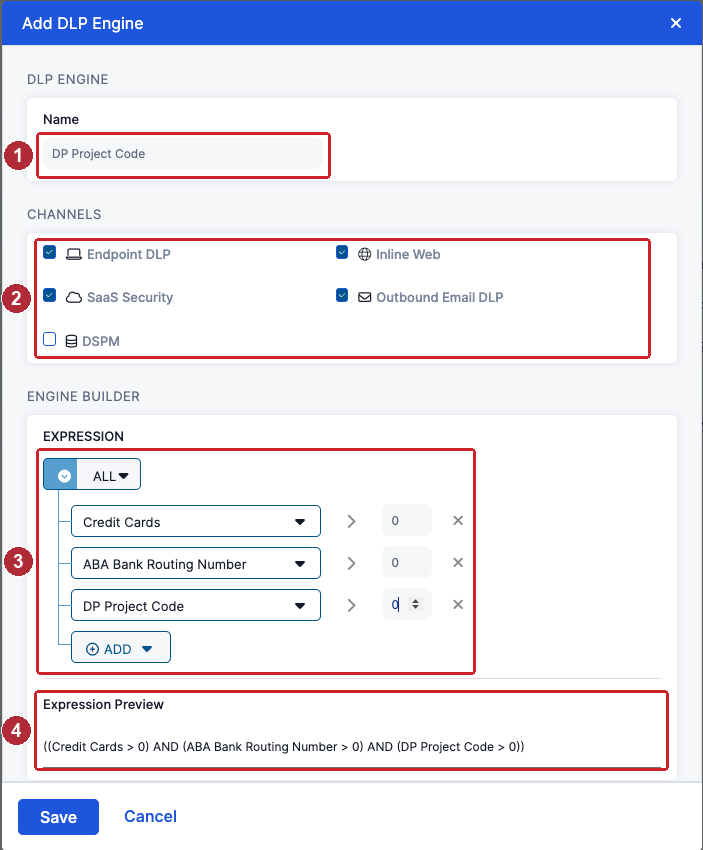
Review the expression preview. It should display:
((Credit Cards > 0) AND (ABA Bank Routing Number > 0) AND (DP Project Code > 0))
All three dictionaries must match: Credit Cards AND ABA Bank Routing Number AND the custom DP Project Code dictionary. Click Save to save the engine.
Step 4: Understand How Detection Logic Supports Enforcement
Connect detection logic to future protection scenarios.
This detection logic will be reused in the following labs:
| Lab | Channel | Action |
|---|---|---|
| Lab 6 | Web | Block sensitive data uploads |
| Lab 7 | Endpoint | Block Application File Access (AFA) and Clipboard transfers |
Lab 8 separately tests preconfigured browser policies for copy-paste controls; it does not reuse this engine.
- Why is it important to combine multiple detection signals instead of relying on a single identifier?
- How does proximity detection reduce false positives?
- What types of organization-specific identifiers should be added to custom dictionaries?
- How does this detection logic support consistent protection across Web and Endpoint environments?
Detection logic defines what is sensitive. Policies define what to do about it.
The DP Project Code engine combines three dictionaries with AND logic and is reused by the Web policy in Lab 6 and the Endpoint policies in Lab 7. Lab 8 demonstrates separate, preconfigured browser controls.
In Lab 5, Alex built a custom DLP detection engine capable of identifying sensitive payroll data. Now it is time to put that engine to work. In this lab, Alex configures an Inline Web DLP policy that blocks unauthorized uploads in real time — and Kevin attempts to upload the Dataparity payroll report to ChatGPT for AI analysis, only to be stopped by Inline Web DLP.
Dependency: This lab requires the Unified DLP Engine created in Lab 5 (DP Project Code). Complete Lab 5 before proceeding.
Scenario Overview
This lab demonstrates the complete Inline Web DLP workflow end-to-end:
| Step | What Happens |
|---|---|
| 1 | Alex creates a custom End User Notification (EUN) |
| 2 | Alex builds an Inline Web DLP policy using the Lab 5 engine |
| 3 | Kevin attempts to upload Dataparity_Q2_2025_Workforce_Financial_Summary.docx to ChatGPT |
| 4 | Inline DLP inspects, detects, and blocks the upload in real time |
| 5 | Kevin receives the custom EUN explaining the denial |
| 6 | Alex reviews the violation in Web Insight Logs |
Use the supplied payroll report to test the Lab 5 engine. DP Project Code requires all three dictionaries to match: Credit Cards AND ABA Bank Routing Number AND the custom DP Project Code dictionary, each with a count greater than zero. Payroll data or SSNs alone do not satisfy this engine.
Task 1 — Admin Experience: Configure Inline DLP Protection
Configure a custom EUN and an Inline Web DLP policy that uses the Lab 5 detection engine to block sensitive uploads.
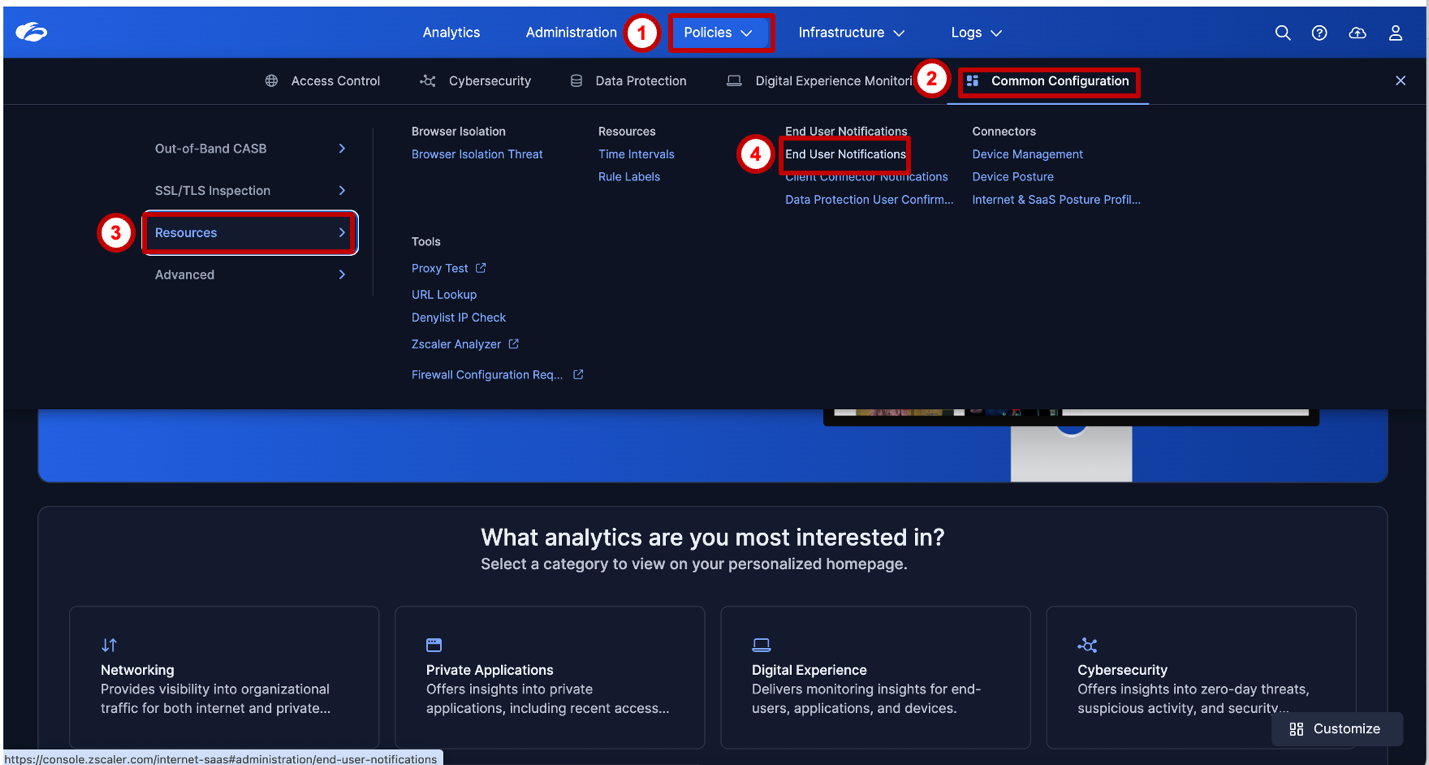
Step 1 — Navigate to End User Notification (EUN)
Alex creates a custom End User Notification to explain why uploads containing sensitive corporate data are blocked. Clear user coaching reduces helpdesk escalations and reinforces security awareness.
Navigate to:
Step 2 — Add a Custom EUN
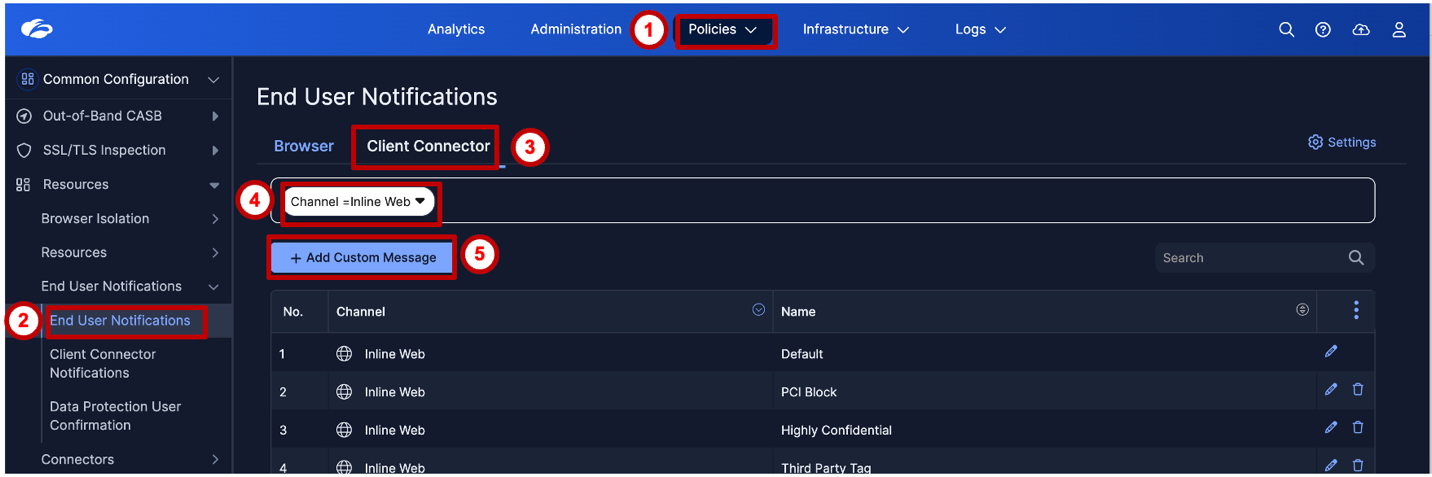
Navigate to the Client Connector tab and click Add Custom Message. Select channel Inline Web.
Step 3 — Add the Custom Message Text
Enter the message that will be displayed to end users when a policy violation occurs. The message should identify the policy, explain the reason for the block, and provide a contact path.
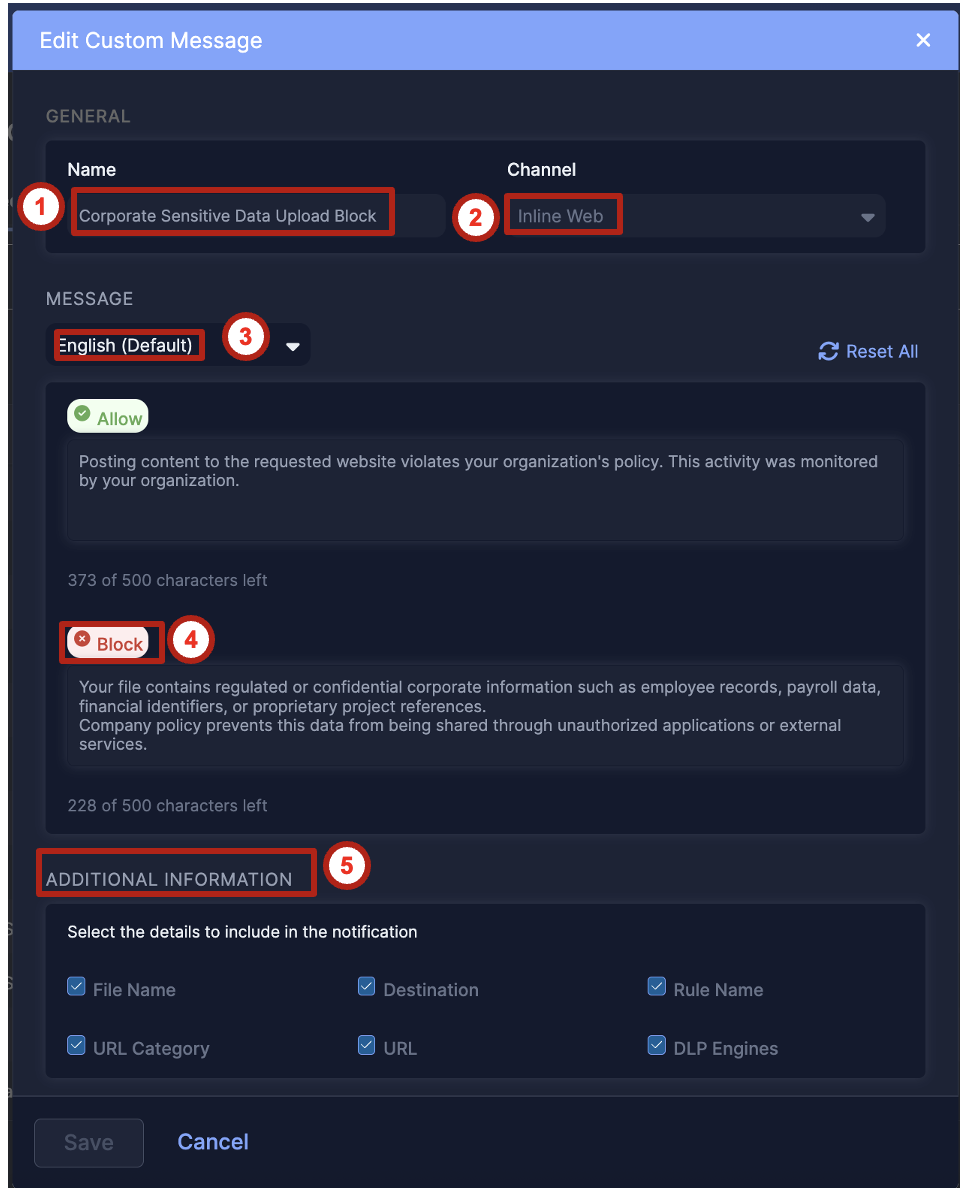
📝 Suggested message: "Your file upload has been blocked because it contains sensitive Dataparity information protected under our Data Security Policy. If you believe this is an error, please contact the Security team at security@dataparity.com."
Step 4 — Navigate to Inline DLP Policy Creation
Navigate to the Inline DLP policy creation page:
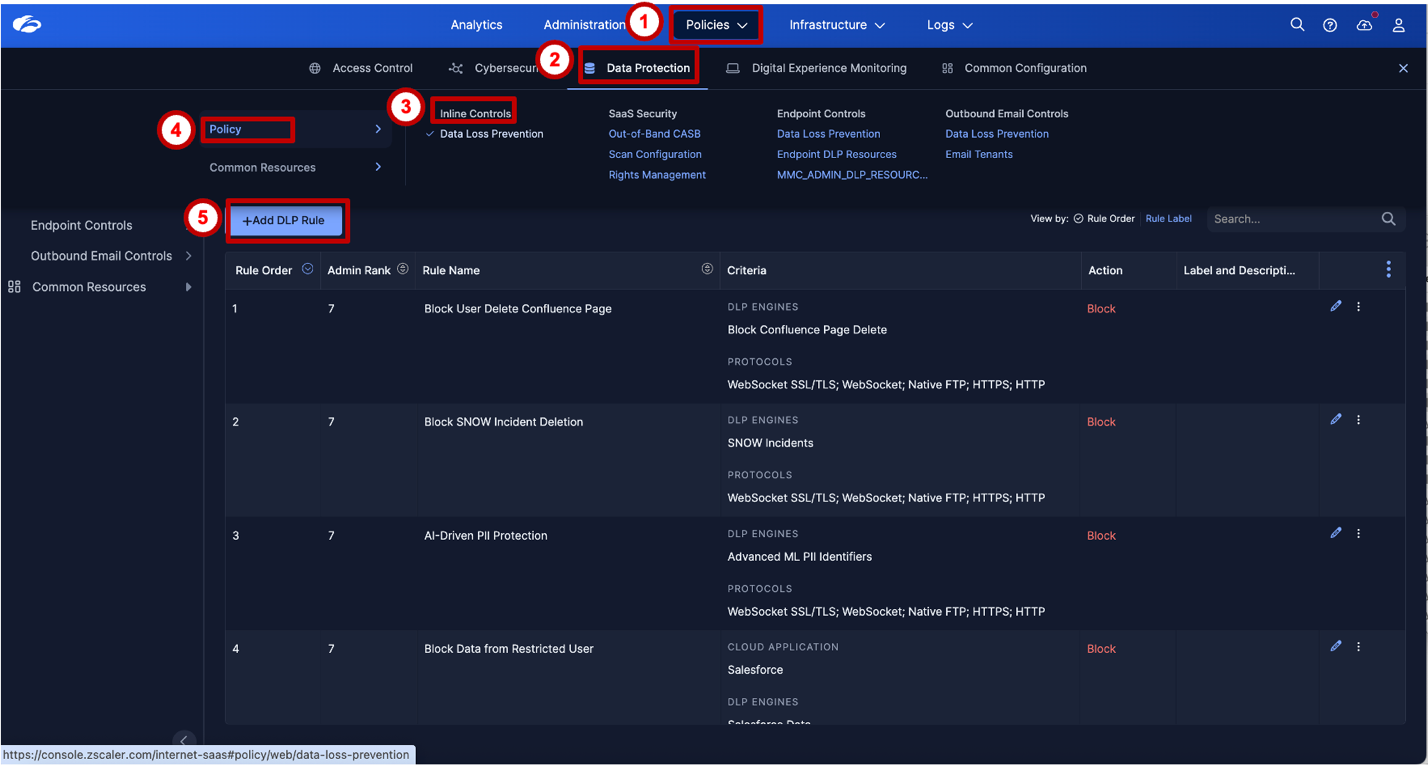
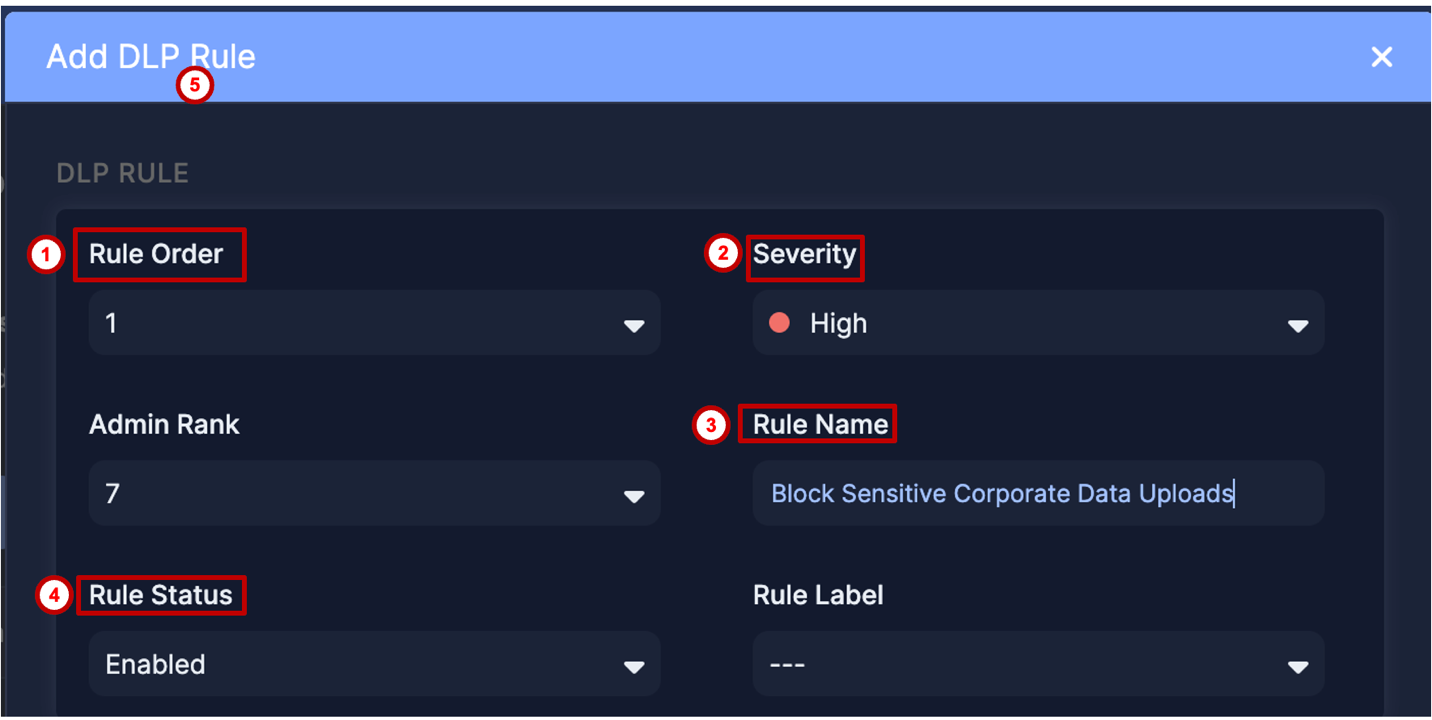
Step 5 — Configure Basic Policy Information
The policy window is large and split across multiple sections. The first section covers the foundational policy settings:
- Policy Name:
Block Sensitive Corporate Data Uploads - Rule Order: Set appropriately for your policy stack
- User Scope: All users (or scoped to the Dataparity employee group)
- Destination / Application Scope: Any destination for this lab (this includes sanctioned and unsanctioned destinations)
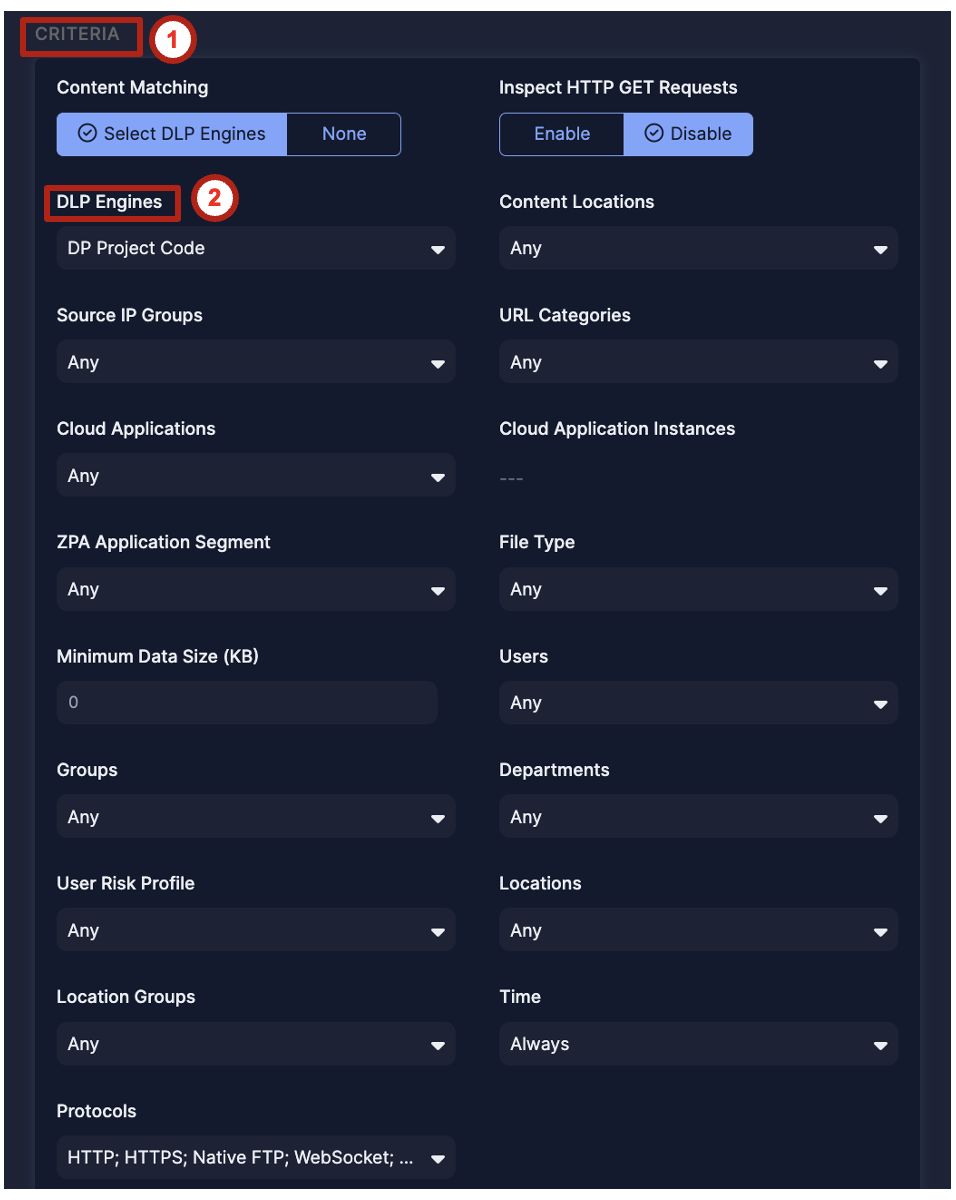
Step 6 — Configure Policy Criteria
In the Criteria section, select the Unified DLP Engine created in Lab 5 — DP Project Code.
This is the key connection point: the detection logic built in Lab 5 is now referenced by an enforcement policy. Lab 7 reuses this engine for Endpoint DLP; Lab 8 uses separate, preconfigured browser policies.
Step 7 — Configure Policy Action
In the Action section:
- Set Action = Block
- Select the End User Notification created in Steps 1–3
This completes the Detection → Enforcement → User Coaching → Logging chain.
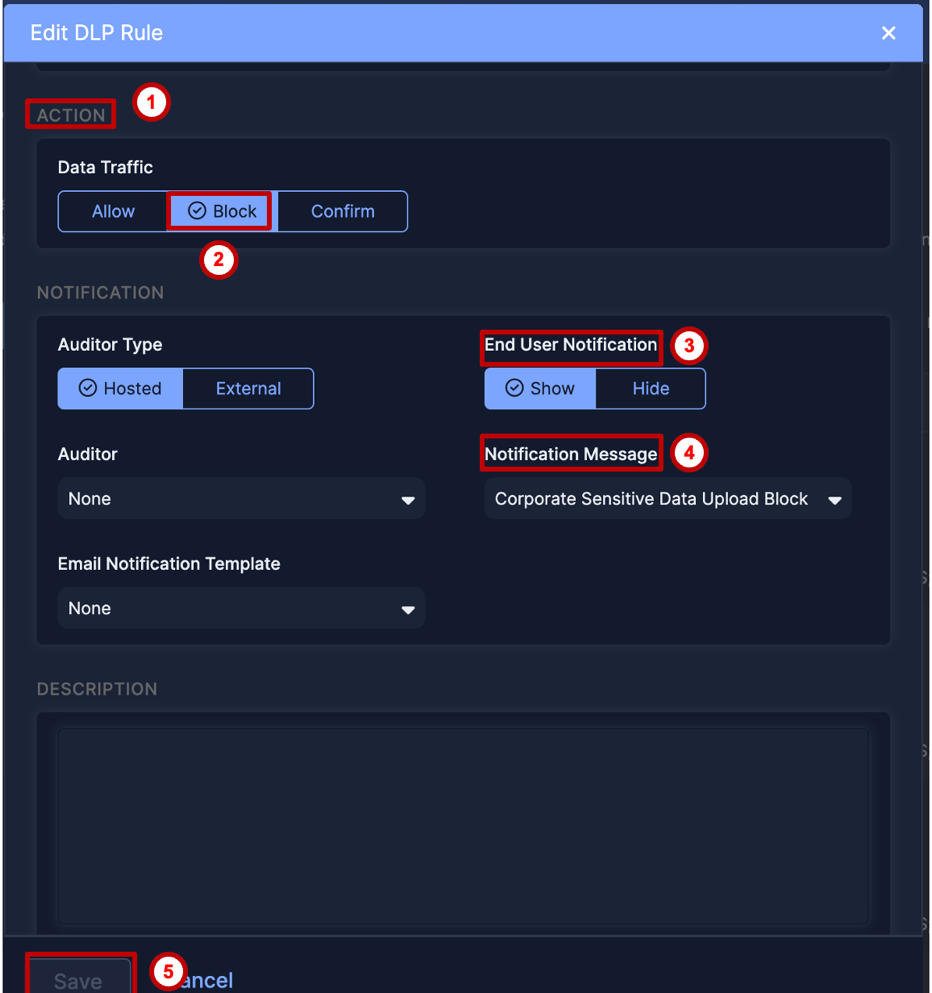
Detection → Enforcement → User Coaching → Logging. This four-step chain is the hallmark of a mature DLP deployment. Detection identifies the risk. Enforcement stops the action. User coaching reduces recurrence. Logging creates an audit trail for investigation.
Most organizations start with detection and logging only (alert mode). The shift to Block + EUN is when DLP moves from visibility to active protection.
Task 2 — User Experience: Prevent Data Exfiltration
Attempt to upload the payroll report to an unsanctioned website and observe the real-time block and user notification.
This task must be performed from the lab VM machine. Complete Pre-Requisites for Module 2, Parts 1–3: verify Inspect for the lab's HTTPS traffic in Part 2, Step 5; confirm ZCC is authenticated with its service ON and all modules active; and verify traffic steering at ip.zscaler.com.
Step 8 — Attempt the Upload
Kevin opens a browser on the lab VM and navigates to https://chatgpt.com — a GenAI platform — to get an AI-powered analysis of the sensitive data.
No ChatGPT account? If a login is required and you cannot or prefer not to sign in, try one of these alternatives, subject to its current account and upload requirements:
- 4shared — https://www.4shared.com
- WeTransfer — https://wetransfer.com
- Box (personal/free) — https://www.box.com
Upload flows and notifications can vary by application. Verify that your chosen destination is covered by the policy and SSL inspection, then confirm the DLP block in your own Web Insights event.
He selects Dataparity_Q2_2025_Workforce_Financial_Summary.docx from the desktop and initiates an upload.
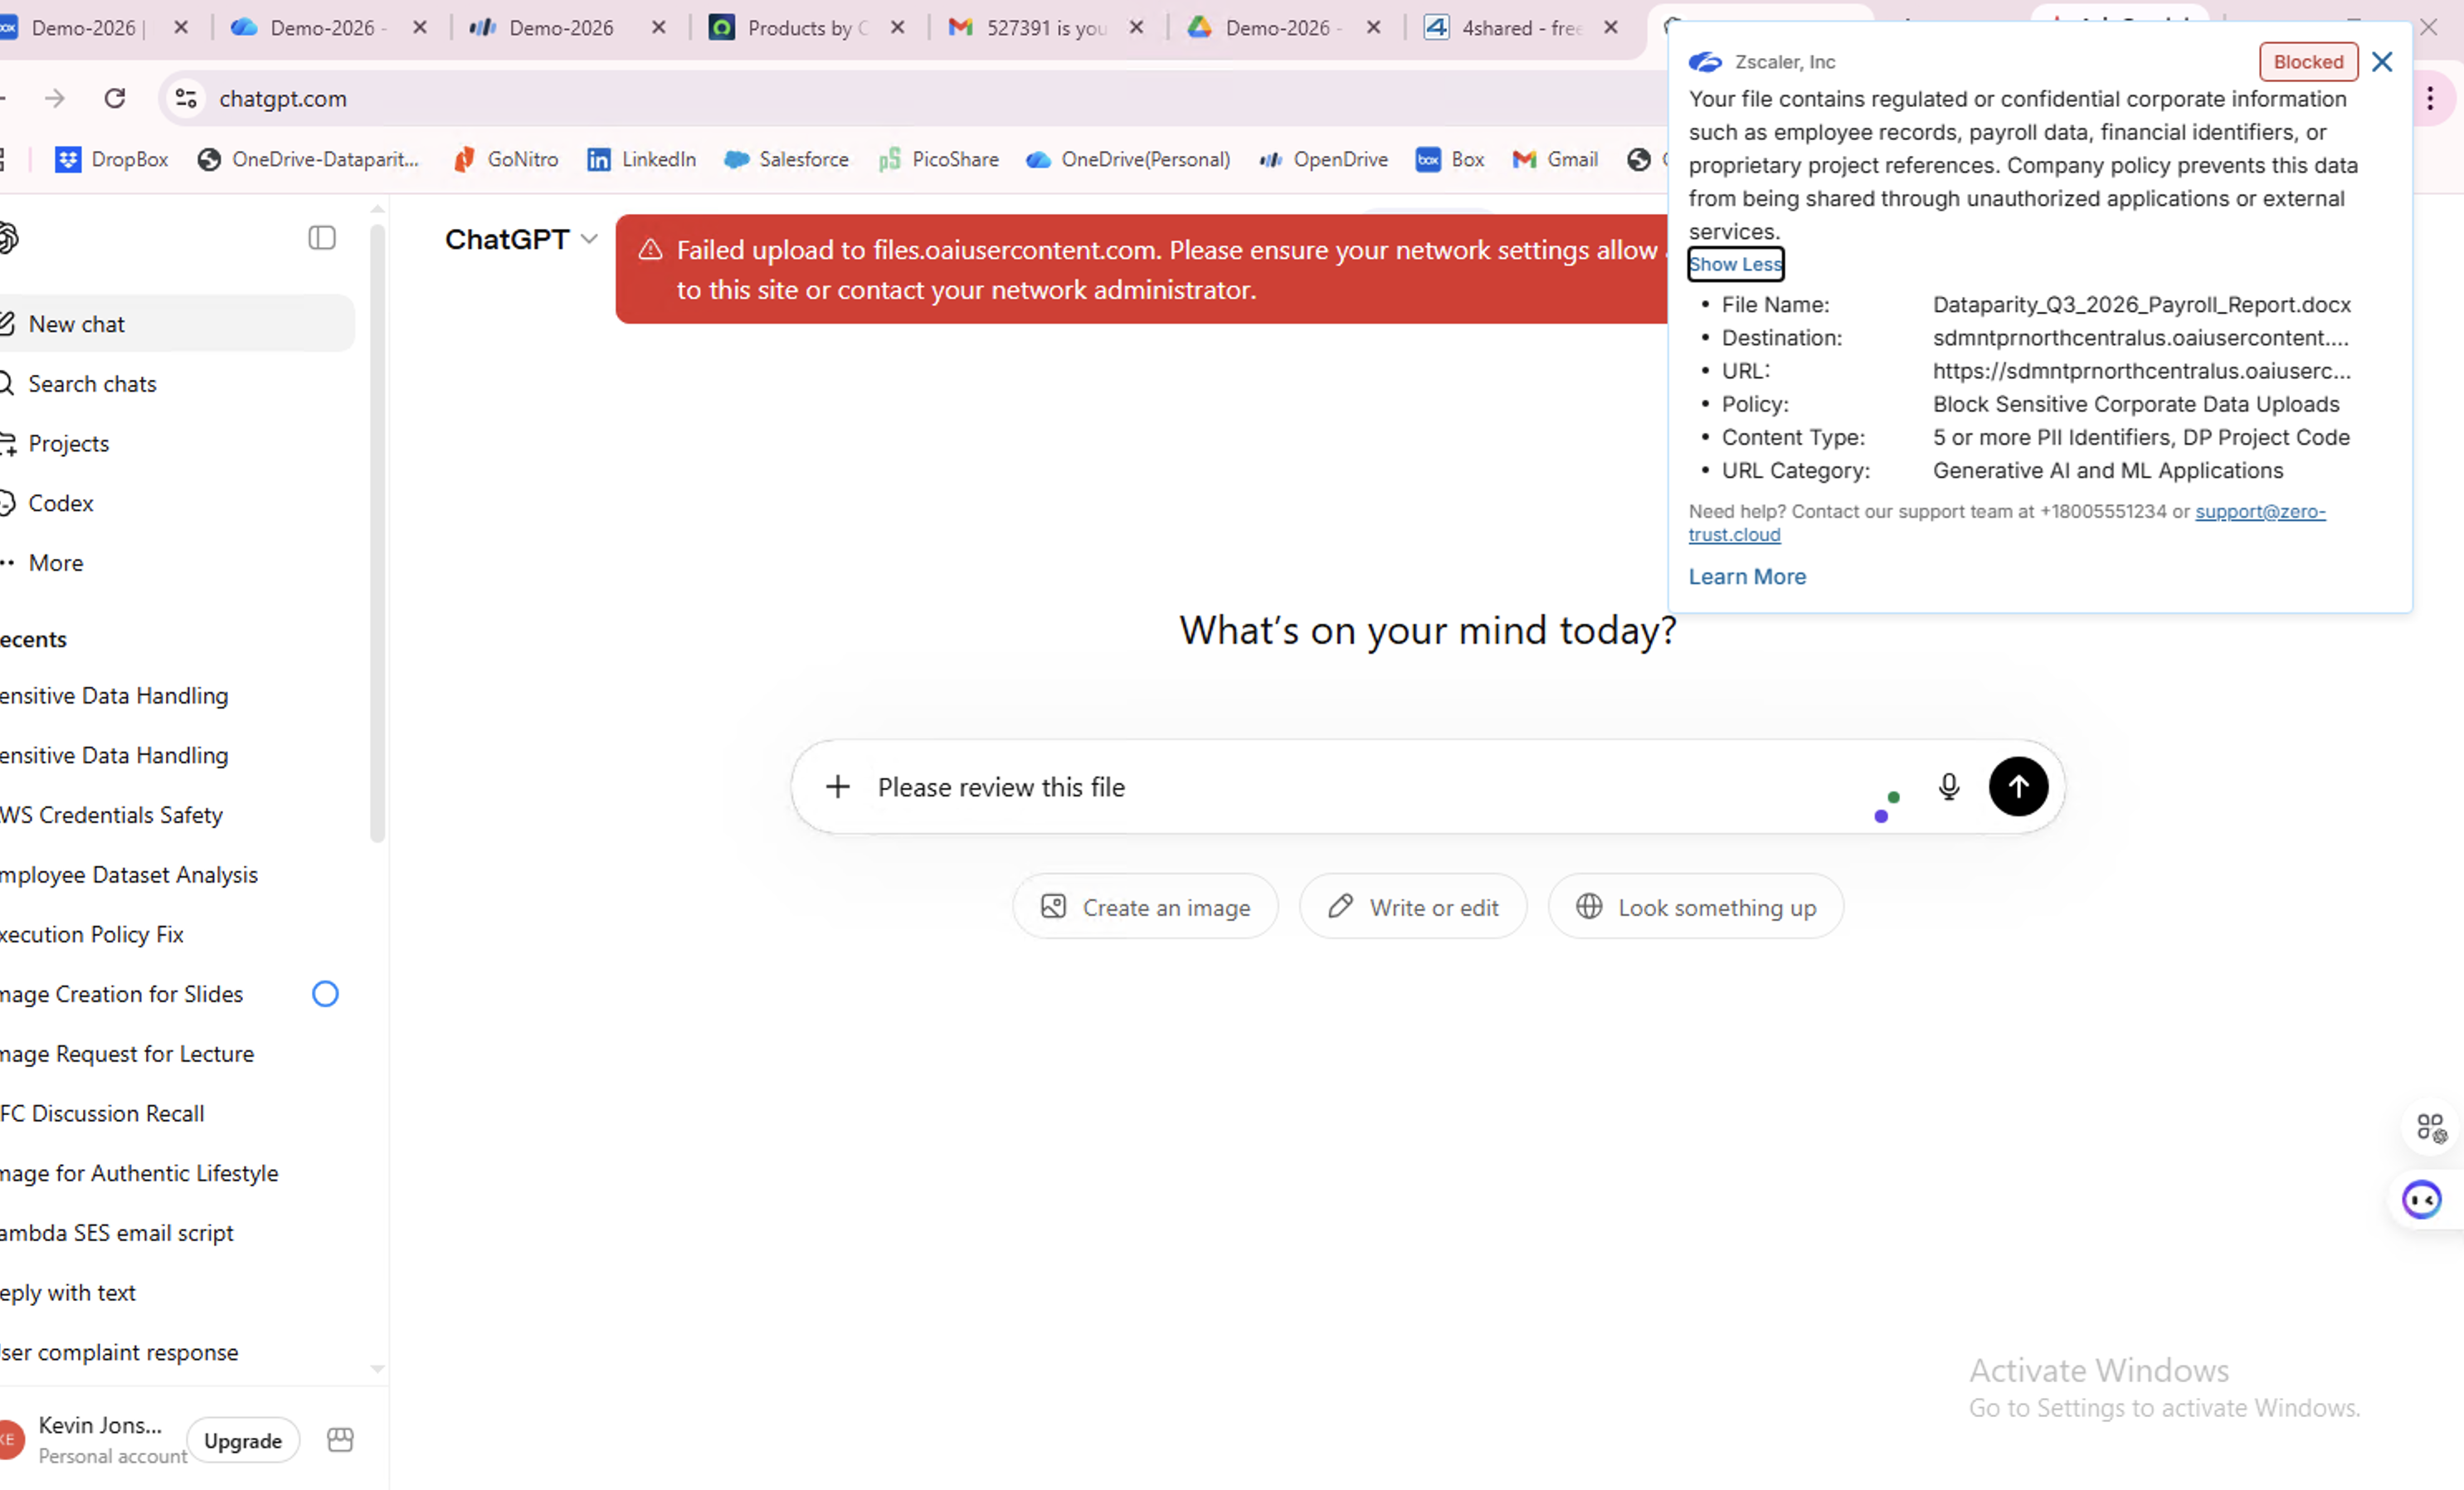
Expected result when the upload is inspected and matches the policy:
- The lab VM's upload traffic is steered through Zscaler with SSL inspection
- Inline DLP inspects the file content
- The DP Project Code engine matches all three dictionary conditions
- The policy blocks the upload; verify the notification and corresponding Web Insights event
Step 9 — Kevin Receives the Block Notification
Instead of a successful upload confirmation, Kevin sees the custom End User Notification Alex configured in Task 1.
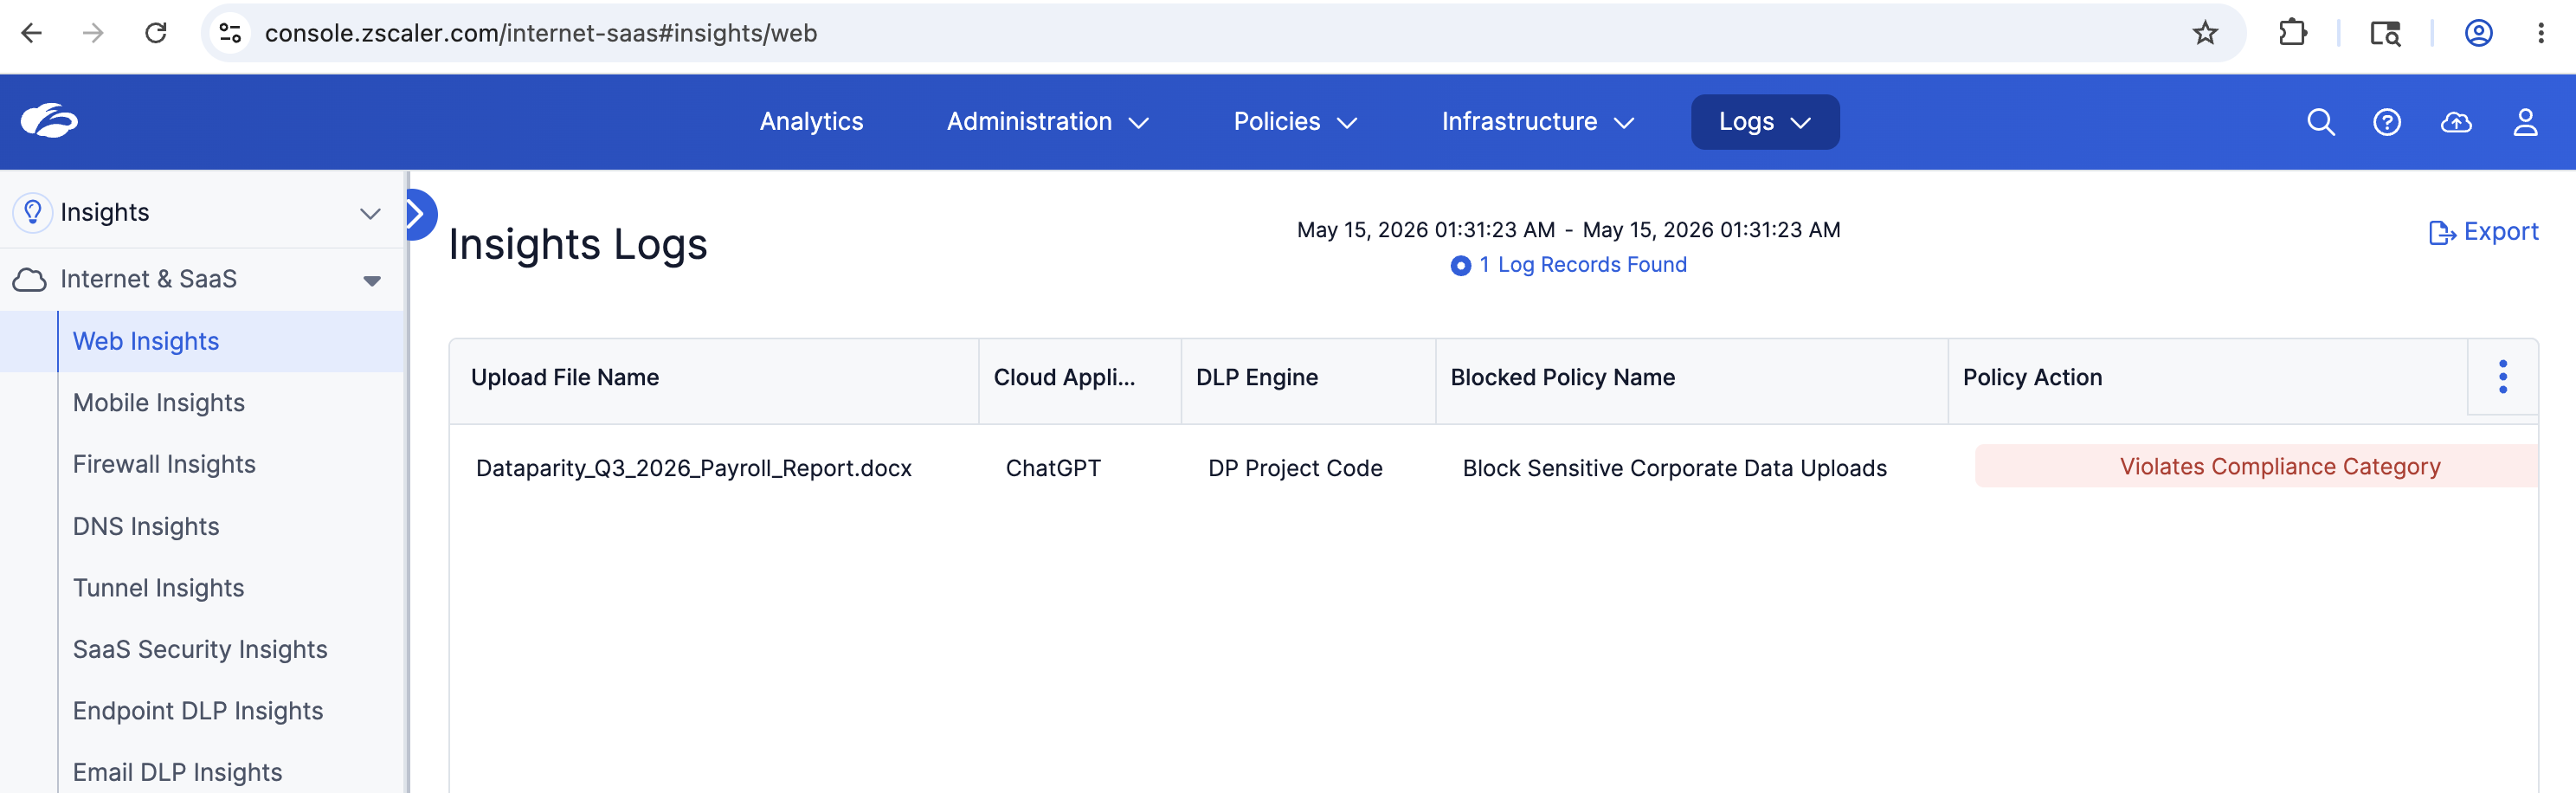
Task 3 — Admin Experience: Review Web Insight Log
Validate that the DLP event was correctly logged in Web Insight with full metadata.
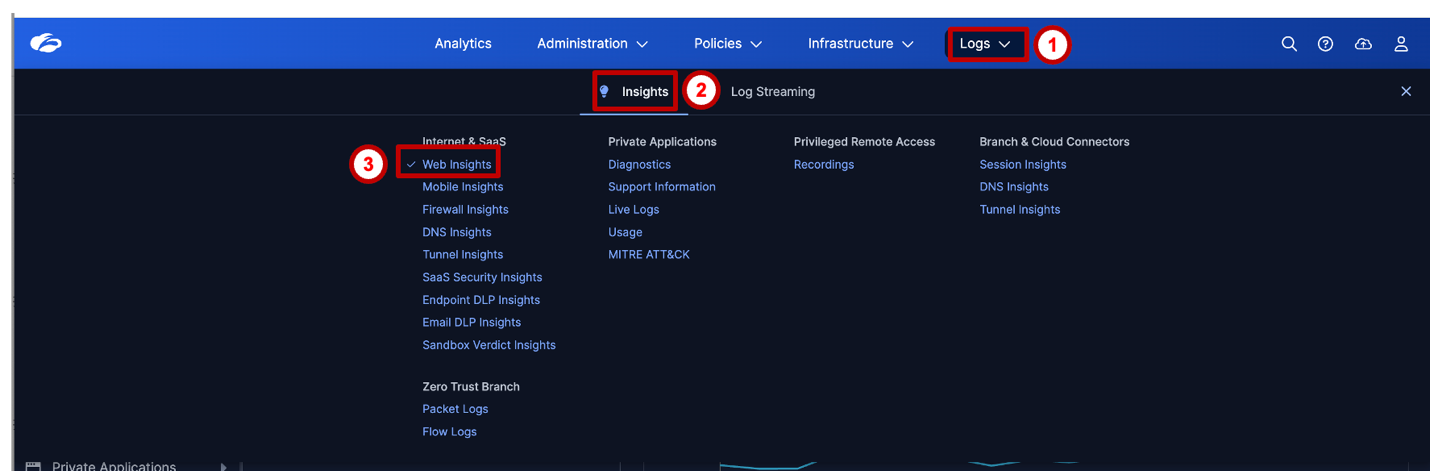
Step 10 — Navigate to Web Insight Logs
Navigate to the Web Insight log viewer:
Step 11 — Apply DLP Engine Filter
Apply a filter to isolate DLP-triggered events:
Filter: DLP Engine = DP Project Code
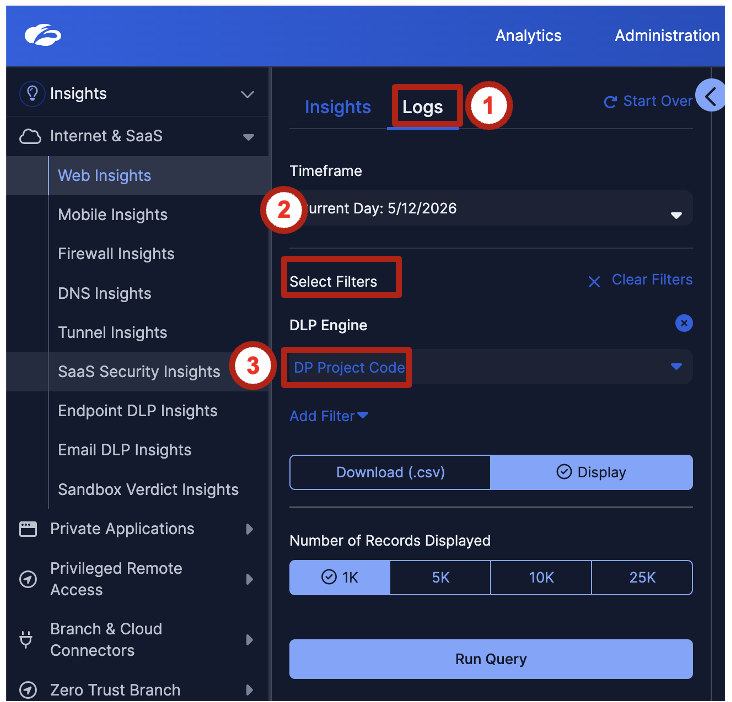
Step 12 — Review Violation Metadata
Locate your upload attempt using its time, signed-in lab identity, and chosen destination. Kevin is the scenario persona; your event should show the actual test identity. Expand the matching event to review the violation record:
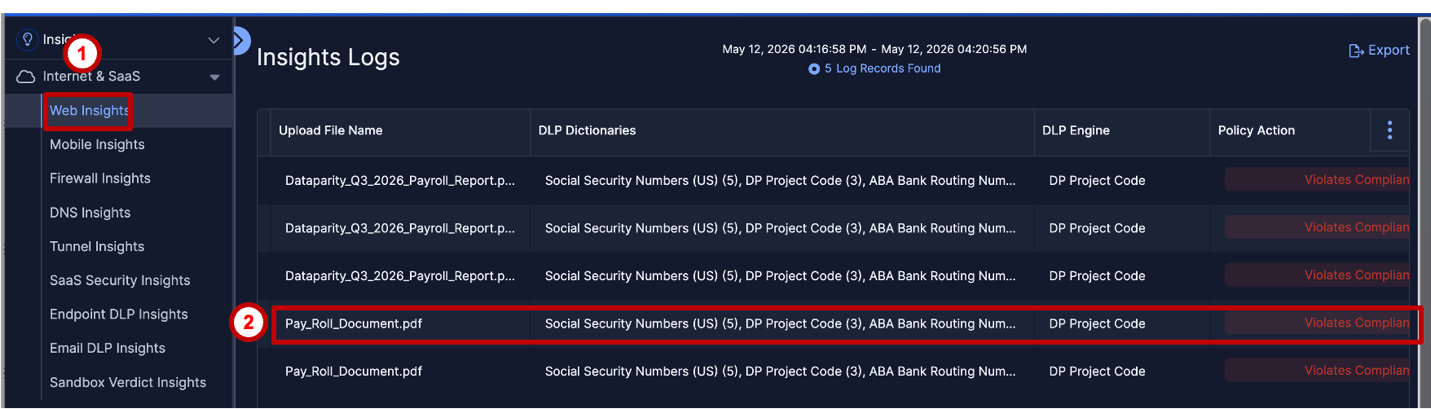
The values below are examples, not a required literal match to the screenshot. Verify your actual identity, VM/IP, chosen destination, rule, engine, file, and action. Display labels and screenshot values can vary.
| Field | Example / What to Verify |
|---|---|
| User Identity | Your signed-in lab identity (playing Kevin) |
| Source Device / IP | Your lab VM / source IP |
| Cloud Application | ChatGPT, or your chosen upload application |
| Policy Triggered | Your rule: Block Sensitive Corporate Data Uploads |
| DLP Engine Matched | Your Lab 5 engine: DP Project Code |
| File Name | Your test file: Dataparity_Q2_2025_Workforce_Financial_Summary.docx |
| File Type | Microsoft Word / DOCX (display label may vary) |
| URL Category | For example, Generative AI and ML Applications for ChatGPT; verify your destination's category |
| Action Taken | Verify Blocked for this test |
This step focuses on event metadata rather than matched content. Lab 9: ZWA SOC Triage switches to the read-only Enterprise Tenant, where Priya reviews prepopulated incidents and their trigger data. Those are separate incidents, not the Lab Tenant event you generated here.
- The policy used Block. When would Alert-only be a better starting posture for a new DLP rule — and what metrics would you use to decide when to escalate to Block?
- Kevin uploaded to ChatGPT — a GenAI tool. How would the policy behave if he attempted the same upload to a sanctioned AI platform like Microsoft Copilot?
- The Web Insight log shows metadata but not trigger content at this stage. Why might you want to limit trigger visibility in the primary log view?
- The Lab 5 DLP engine is shared by Labs 6 and 7. What governance process would you use to control who can modify a shared detection engine?
GenAI uploads can expose sensitive corporate data. This lab uses the Lab 5 engine to block inspected uploads that match the configured Inline Web DLP policy. Confirm the result through the user notification and your own Web Insights event.
Lab 7 reuses the engine for Endpoint DLP Application File Access (AFA) and Clipboard controls. Lab 8 tests separate, preconfigured browser policies for copy-paste controls; it does not reuse this engine.
Kevin's file upload to ChatGPT was blocked in Lab 6 by Inline Web DLP. Undeterred, he decides to try a completely different approach — one that bypasses the network proxy entirely. First he tries to open the sensitive file directly in Notepad++. Then, when that fails, he opens it in Word and tries to copy and paste the content instead. Neither the proxy nor the browser can stop these OS-level actions. Only Endpoint DLP can.
Kevin's new attempts happen entirely on the endpoint — no network request, no HTTP POST, no file transfer. The controls that cannot catch these actions are:
| Control | Why it misses |
|---|---|
| Inline Web DLP (Lab 6) | No network traffic — file access and clipboard never leave the OS |
| Browser DLP (Lab 8) | Only covers actions inside the browser |
| Proxy inspection | Proxy can inspect archive files up to 5 levels — but these actions never reach the network |
Endpoint DLP operates at the OS layer — intercepting file read attempts and clipboard operations before any data can be extracted, regardless of protocol, application, or network path.
Prerequisite — Verify Notepad++ on the Lab VM
Notepad++ is pre-installed on the CloudShare VM, as described in Pre-Requisites for Module 2. Confirm it is available before Task 1. If it is missing, ask your facilitator to check the VM setup.
Complete Lab 5 first: both rules in this lab use the DP Project Code engine.
Task 1 — Block Application File Access to Sensitive Documents
Configure an Application File Access rule, verify the Notepad++ application definition in DLP Resources, push the policy to the endpoint, then confirm Kevin's file open attempt is blocked and logged.
Step 1 — Navigate to Endpoint DLP Policy
Navigate to the Endpoint DLP policy page:
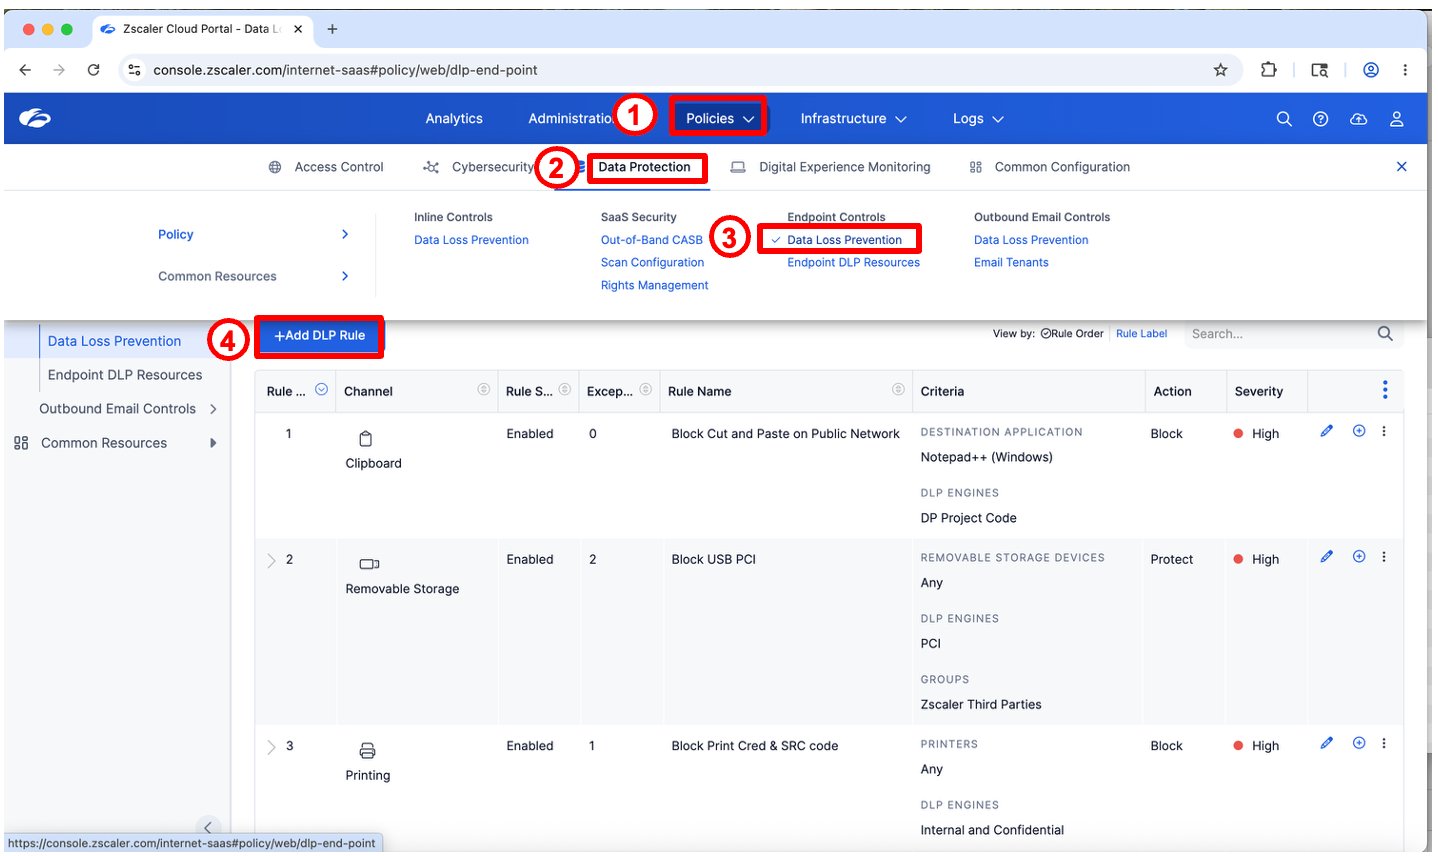
Review the policy list. You will create the Application File Access rule below. If your assigned tenant already contains the same lab rule, review and update it rather than creating a duplicate.
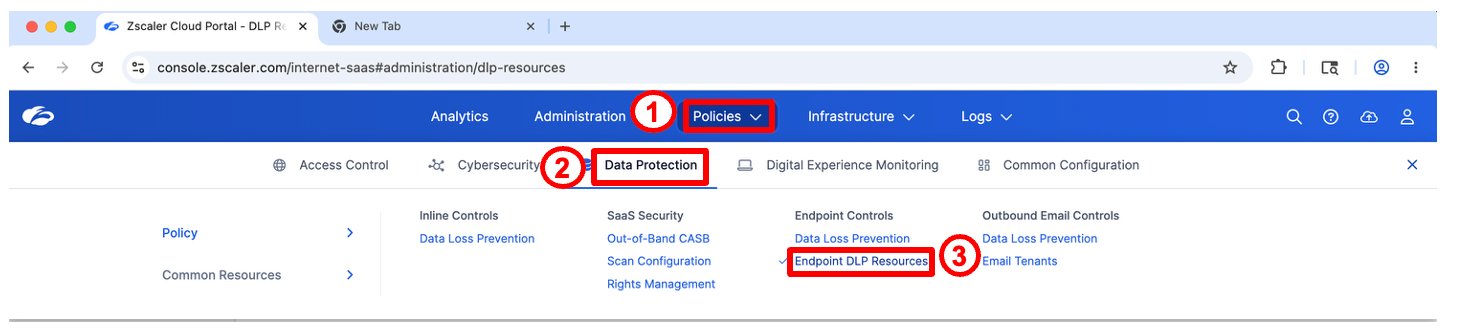
Step 2 — Navigate to Endpoint DLP Resources
Before creating the AFA rule, review how applications are defined. Navigate to:
Step 3 — Review the Notepad++ Application Definition
In DLP Resources, click the Applications tab and search for notepad. Click the eye icon to view the Notepad++ (Windows) definition.
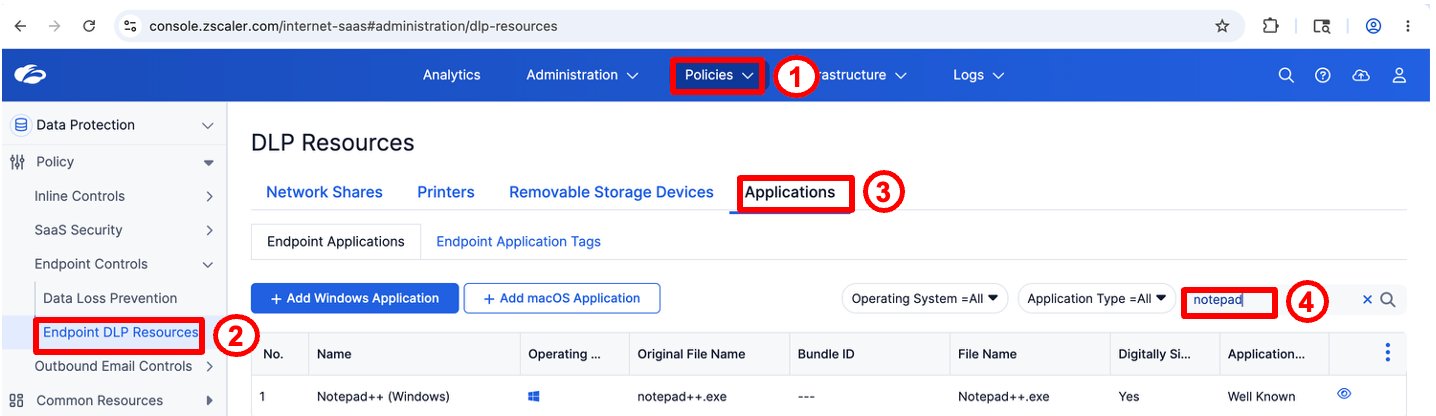
| Field | Value |
|---|---|
| Name | Notepad++ (Windows) |
| Original File Name | notepad++.exe |
| File Name | Notepad++.exe |
| Digitally Signed | Yes |
| Application Type | Well Known |
Application definitions use Original File Name + File Name + Digital Signature to uniquely identify an application. The digital signature check ensures the policy applies to the genuine Notepad++ binary — a renamed or unsigned copy would not match.
Step 4 — Create the Application File Access Rule
Navigate back to Endpoint DLP Policy and click + Add DLP Rule:
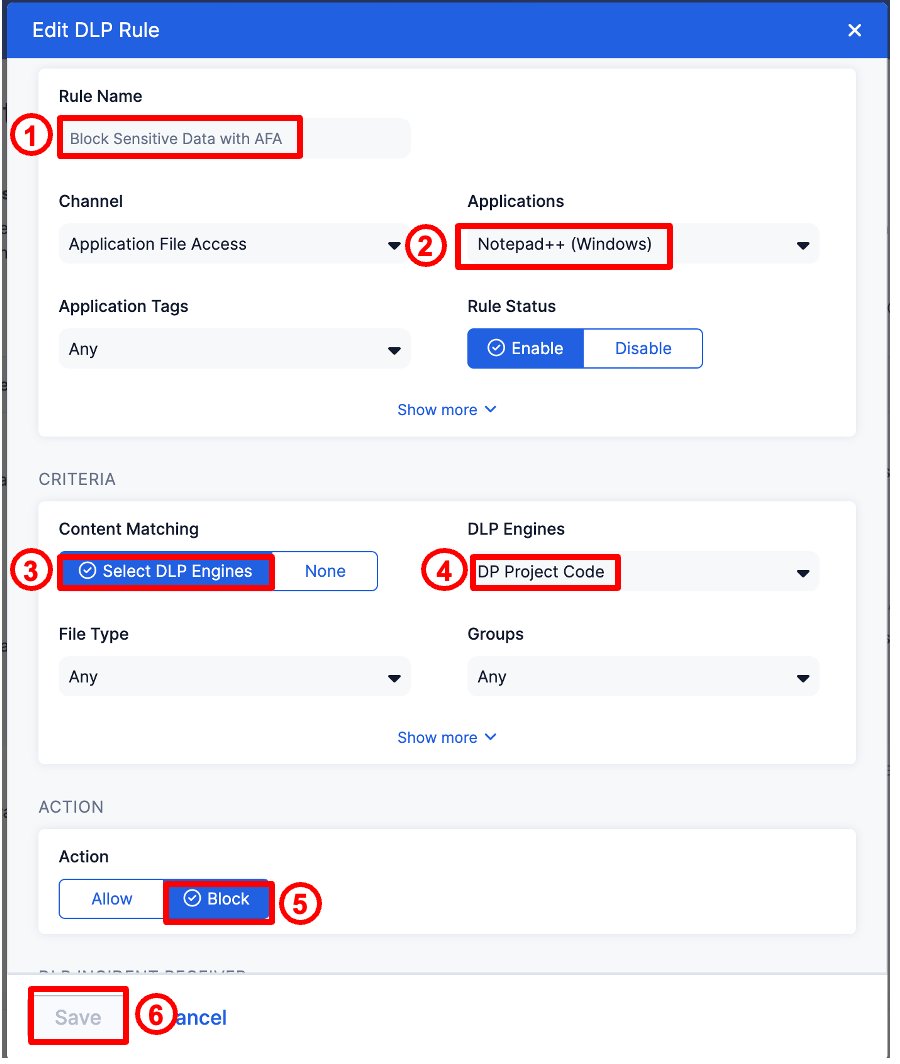
| Field | Value |
|---|---|
| Rule Name | Block Sensitive Data with AFA |
| Channel | Application File Access |
| Applications | Notepad++ (Windows) |
| DLP Engines | DP Project Code |
| Action | Block |
| Rule Status | Enable |
Callout 1 — Rule Name:
Block Sensitive Data with AFACallout 2 — Channel: Application File Access Callout 3 — Content Matching: Select DLP Engines Callout 4 — DLP Engines: DP Project Code — same engine from Lab 5 Callout 5 — Action: Block Callout 6 — Click Save
Step 5 — Push the Updated Policy to the Endpoint
After saving the rule, the policy must be pushed to the endpoint agent. On the lab VM:
- Right-click the Zscaler icon in the system tray
- Click Open Zscaler
- Navigate to Data Protection
- Click Update DLP Policy
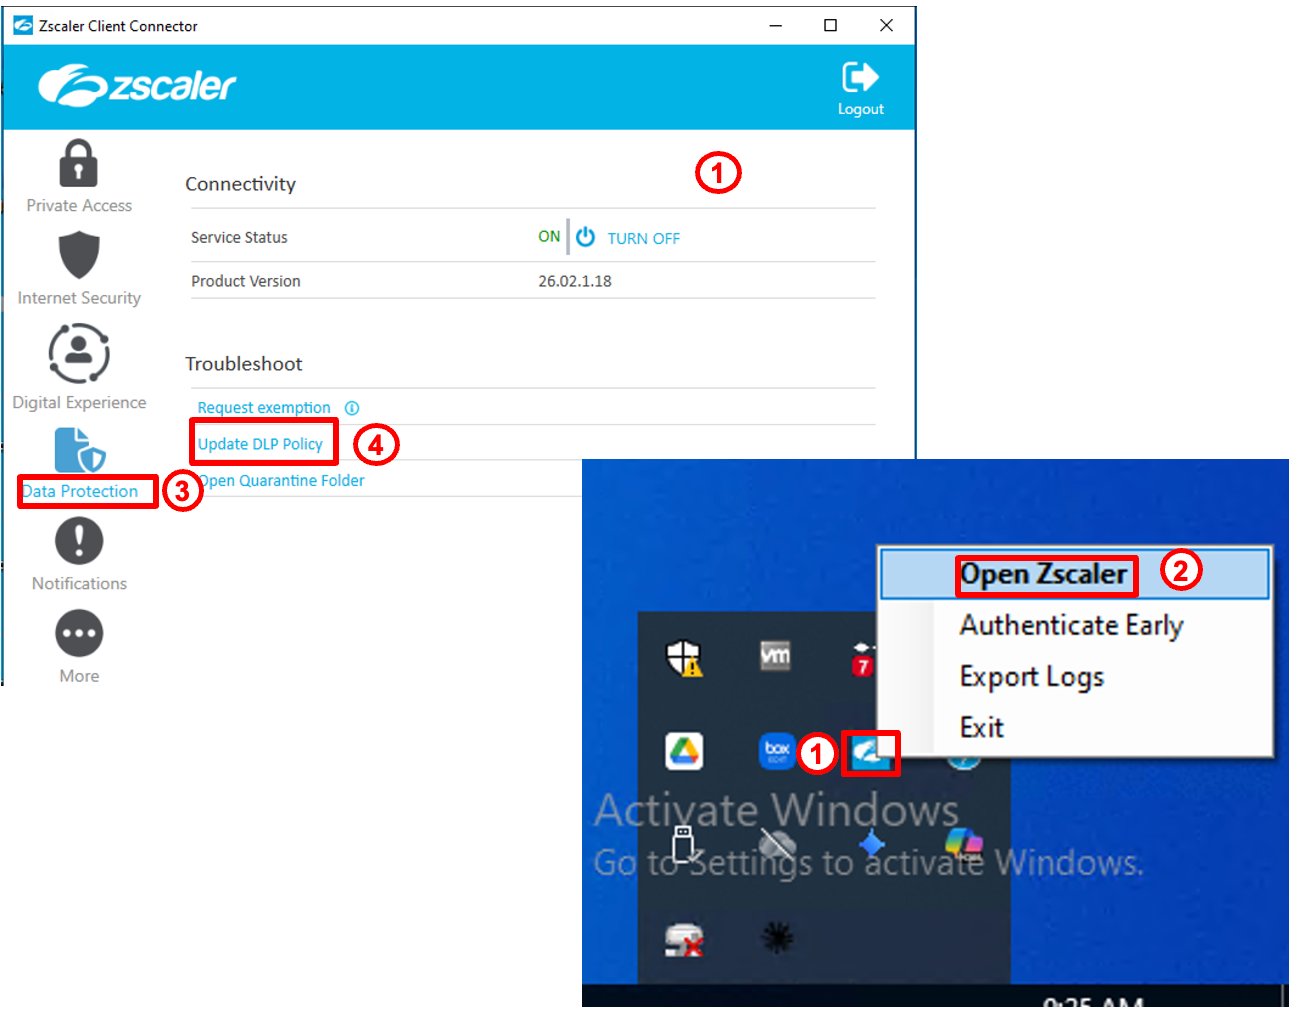
Callout 1 — ZCC Connectivity: Service Status ON Callout 2 — Right-click ZCC tray icon → Open Zscaler Callout 3 — Click Data Protection Callout 4 — Click Update DLP Policy
Step 6 — Kevin Attempts to Open the File in Notepad++
Kevin right-clicks Dataparity_Q2_2025_Workforce_Financial_Summary.docx on the desktop and selects Edit with Notepad++.
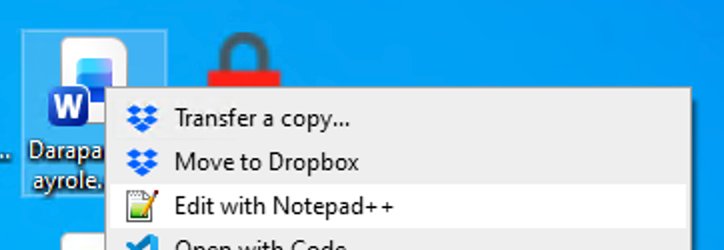
The moment Notepad++ attempts to read the file, Application File Access intercepts at the OS layer — before any data reaches the application.
Step 7 — Endpoint DLP Blocks the File Read
Kevin sees two simultaneous events:
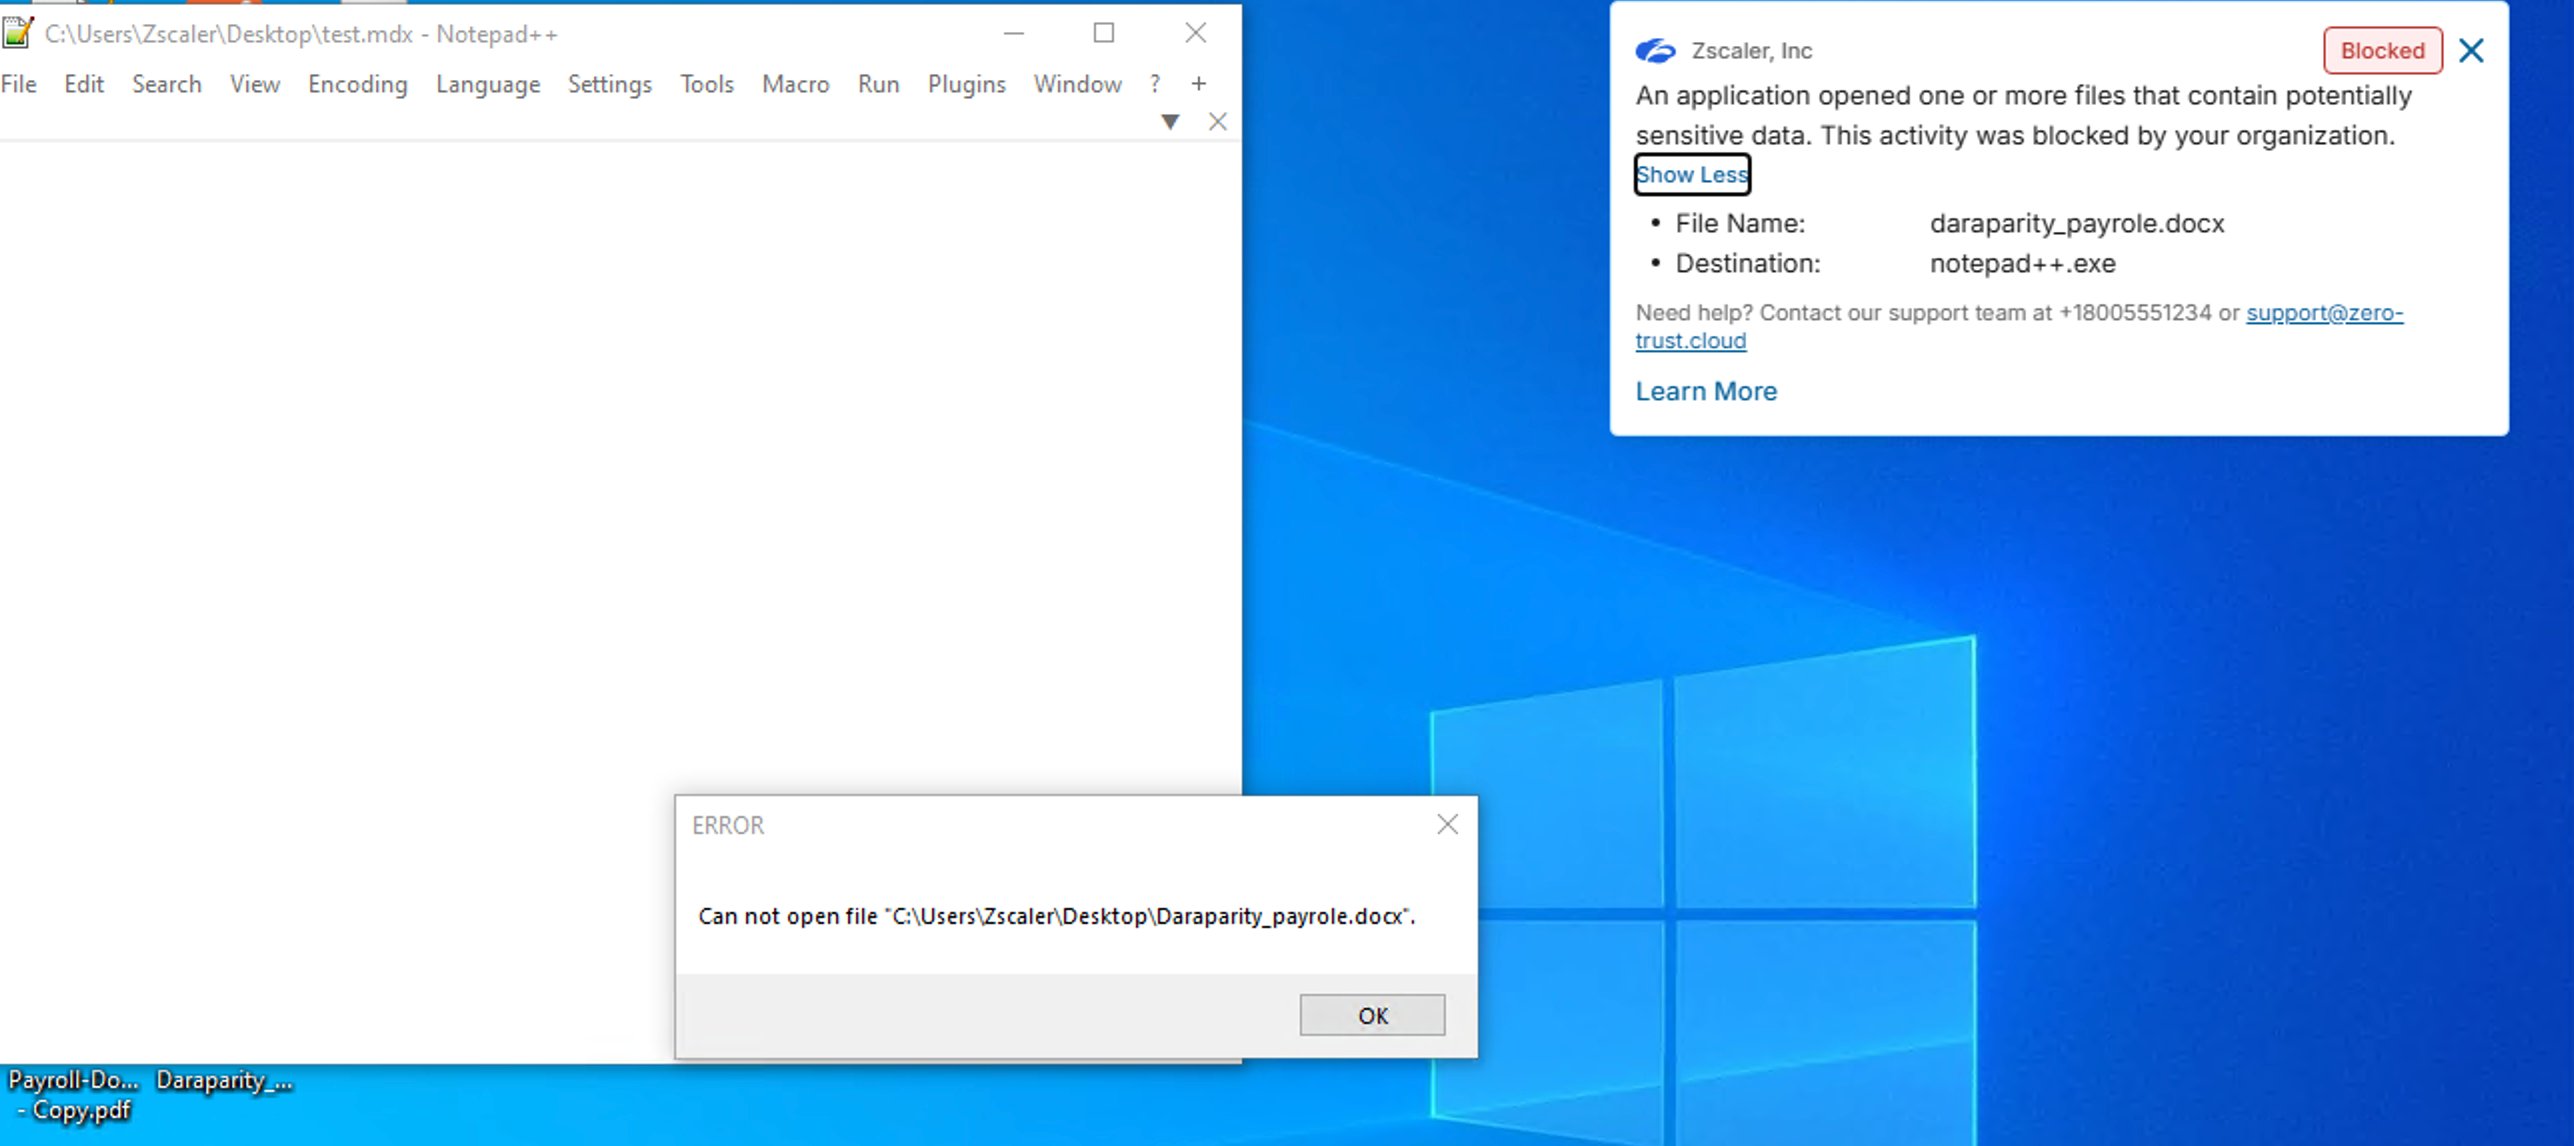
Zscaler block notification:
Blocked An application opened one or more files that contain potentially sensitive data. This activity was blocked by your organization.
- File Name: Dataparity_Q2_2025_Workforce_Financial_Summary.docx
- Destination: notepad++.exe
Notepad++ error dialog:
ERROR — Can not open file
C:\Users\Zscaler\Desktop\Dataparity_Q2_2025_Workforce_Financial_Summary.docx
Notepad++ never displayed a single byte. The OS-level block happened before the application received any data.
Step 8 — Navigate to Endpoint DLP Insights
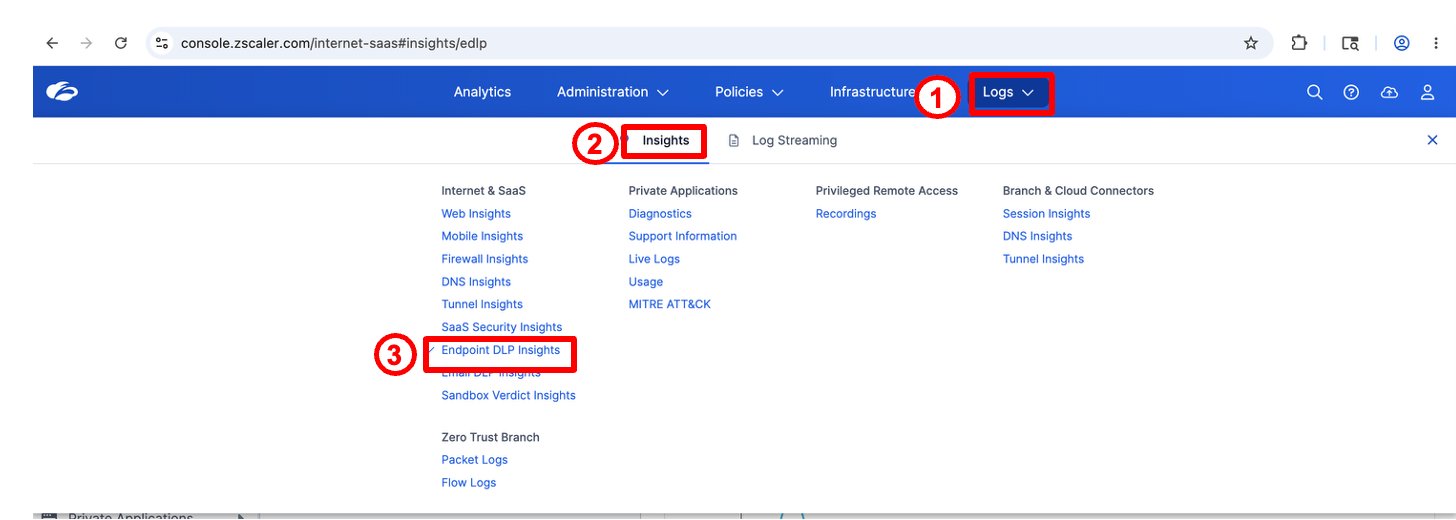
Callout 1 — Click Logs in the top nav Callout 2 — Select Insights Callout 3 — Click Endpoint DLP Insights
Step 9 — Review the AFA Violation Log
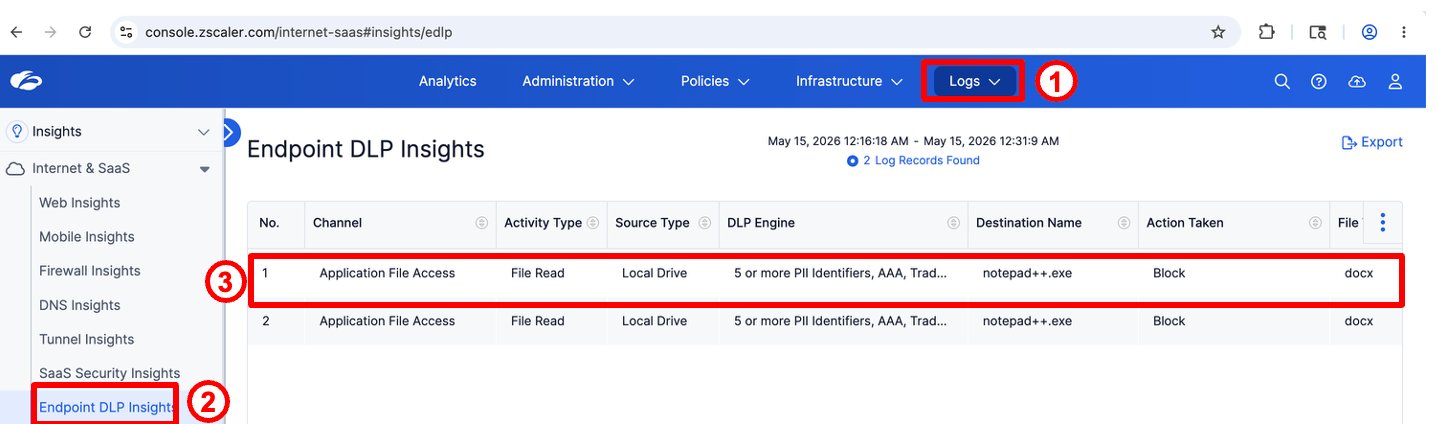
Locate the Application File Access event for your test. Screenshot counts and engine labels may differ; verify your event against the rule you configured:
| Field | Expected value for your test |
|---|---|
| Channel | Application File Access |
| Activity Type | File Read |
| Source Type | Local Drive |
| DLP Engine | DP Project Code |
| Destination Name | notepad++.exe |
| Action Taken | Block |
| File Type | docx |
Activity Type: File Read is the key differentiator from the Clipboard channel. This tells Alex exactly what Kevin attempted — a direct file read by an unauthorized application — not a network upload or clipboard operation.
Task 2 — Block Clipboard Exfiltration to Local Applications
Demonstrate that even when Kevin uses a legitimate application to access the file, Endpoint DLP Clipboard control blocks the paste into an unauthorized destination.
Kevin's reasoning: "Zscaler blocked Notepad++ from reading the file directly. But Word is allowed to open it — it's the legitimate app for .docx files. If I open it in Word, copy the content, and paste it into Notepad++, maybe the endpoint agent won't catch it."
He's right that Word can open the file — Application File Access doesn't block sanctioned applications. But the Clipboard channel catches the copy/paste at the OS clipboard layer, regardless of which application the content came from.
This task must be performed from the lab VM machine. Ensure the Zscaler Client Connector is running before proceeding.
Step 1 — Navigate to Endpoint DLP Policy
As Alex, open the Endpoint DLP policy page:
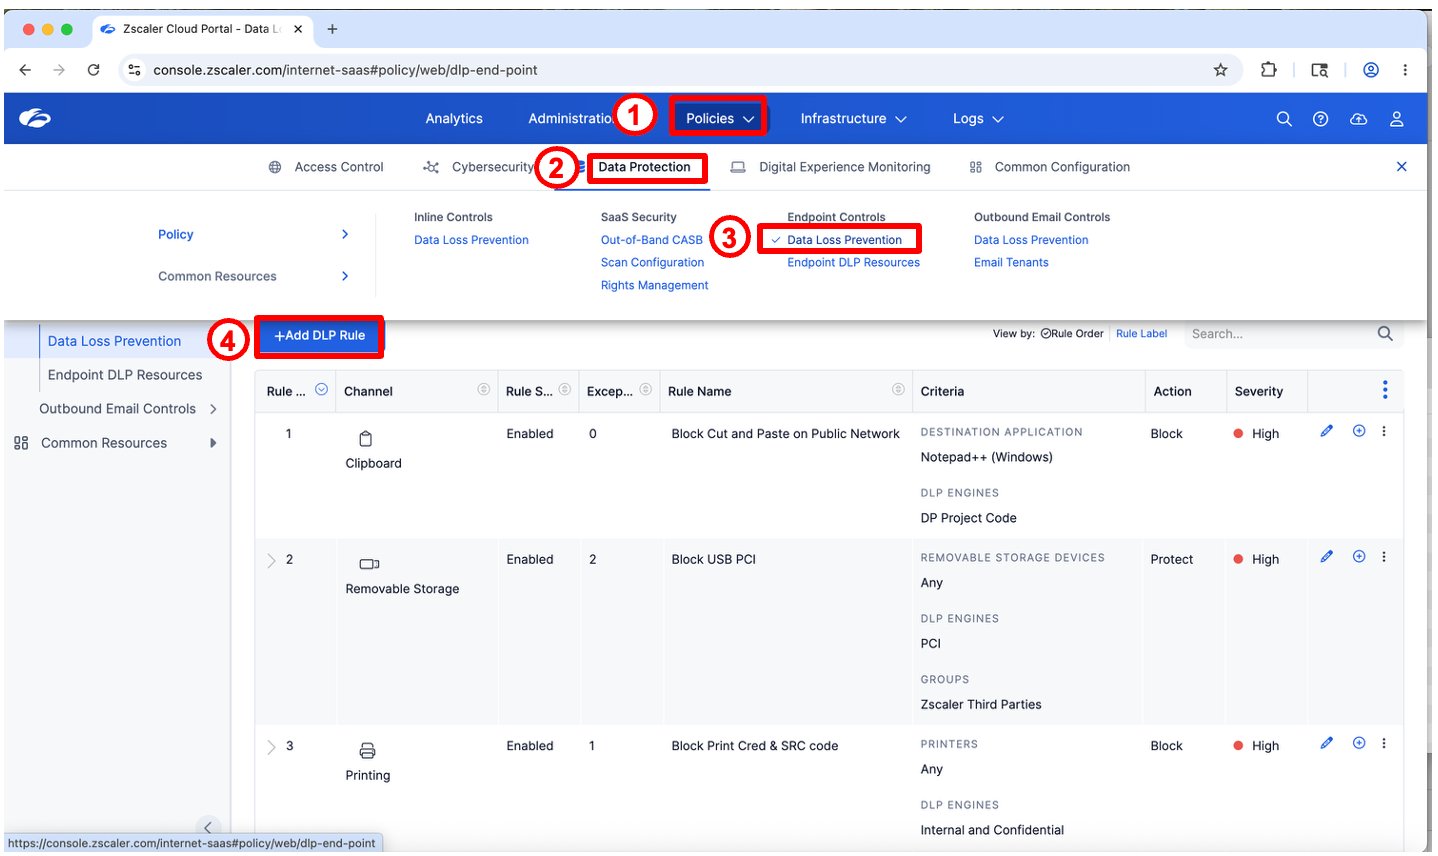
The screenshot shows an existing Clipboard rule. Rule names and order may differ in your tenant.
Step 2 — Configure the Clipboard DLP Rule
Click + Add DLP Rule and configure Block Cut_n_Paste Sensitive Data below. If that lab rule already exists, edit it instead.
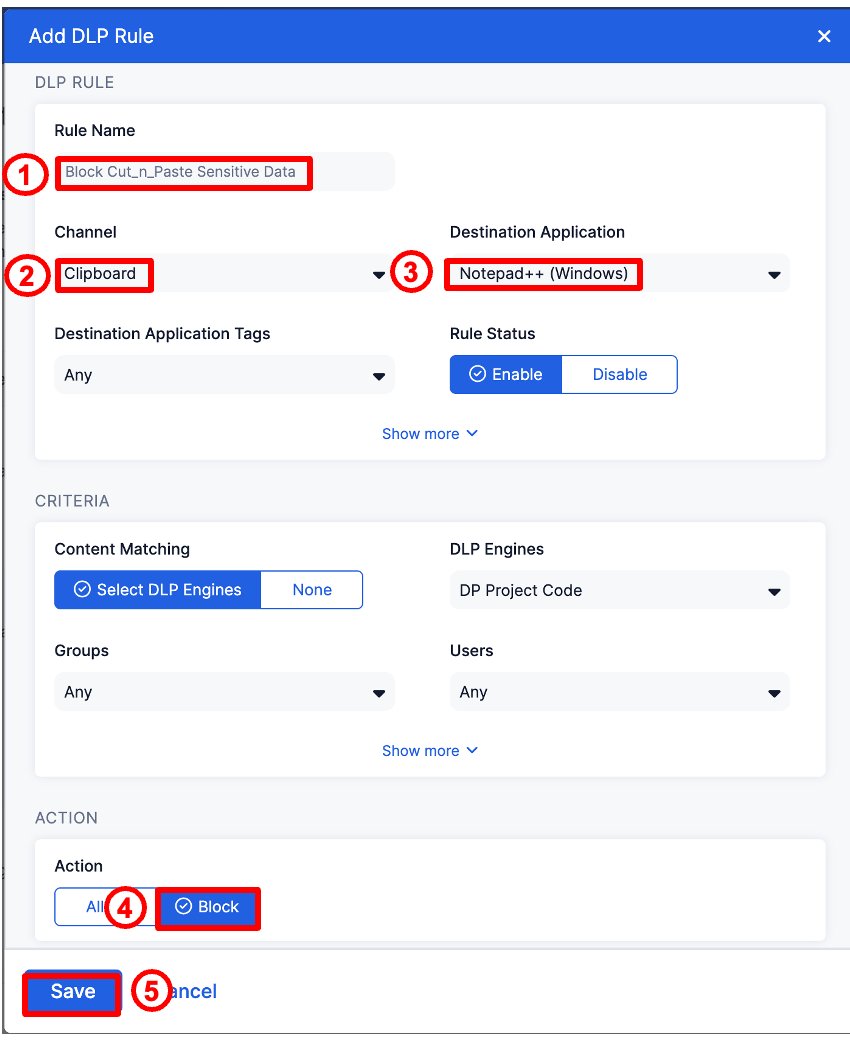
| Field | Value |
|---|---|
| Rule Name | Block Cut_n_Paste Sensitive Data |
| Channel | Clipboard |
| Destination Application | Notepad++ (Windows) |
| DLP Engines | DP Project Code |
| Rule Status | Enable |
| Action | Block |
Click Save.
The Clipboard rule is scoped to Notepad++ (Windows) as the destination. This means paste of sensitive content is blocked specifically when the destination is Notepad++. Setting the destination to Any would block paste of sensitive content into any application on the endpoint — email clients, chat tools, IDE editors, or any other process.
Scoping to a specific application allows a graduated rollout — start with the highest-risk destinations, then expand once the policy is tuned.
Step 3 — Push Updated Policy to Endpoint
After saving the Clipboard rule, push the policy to the endpoint:
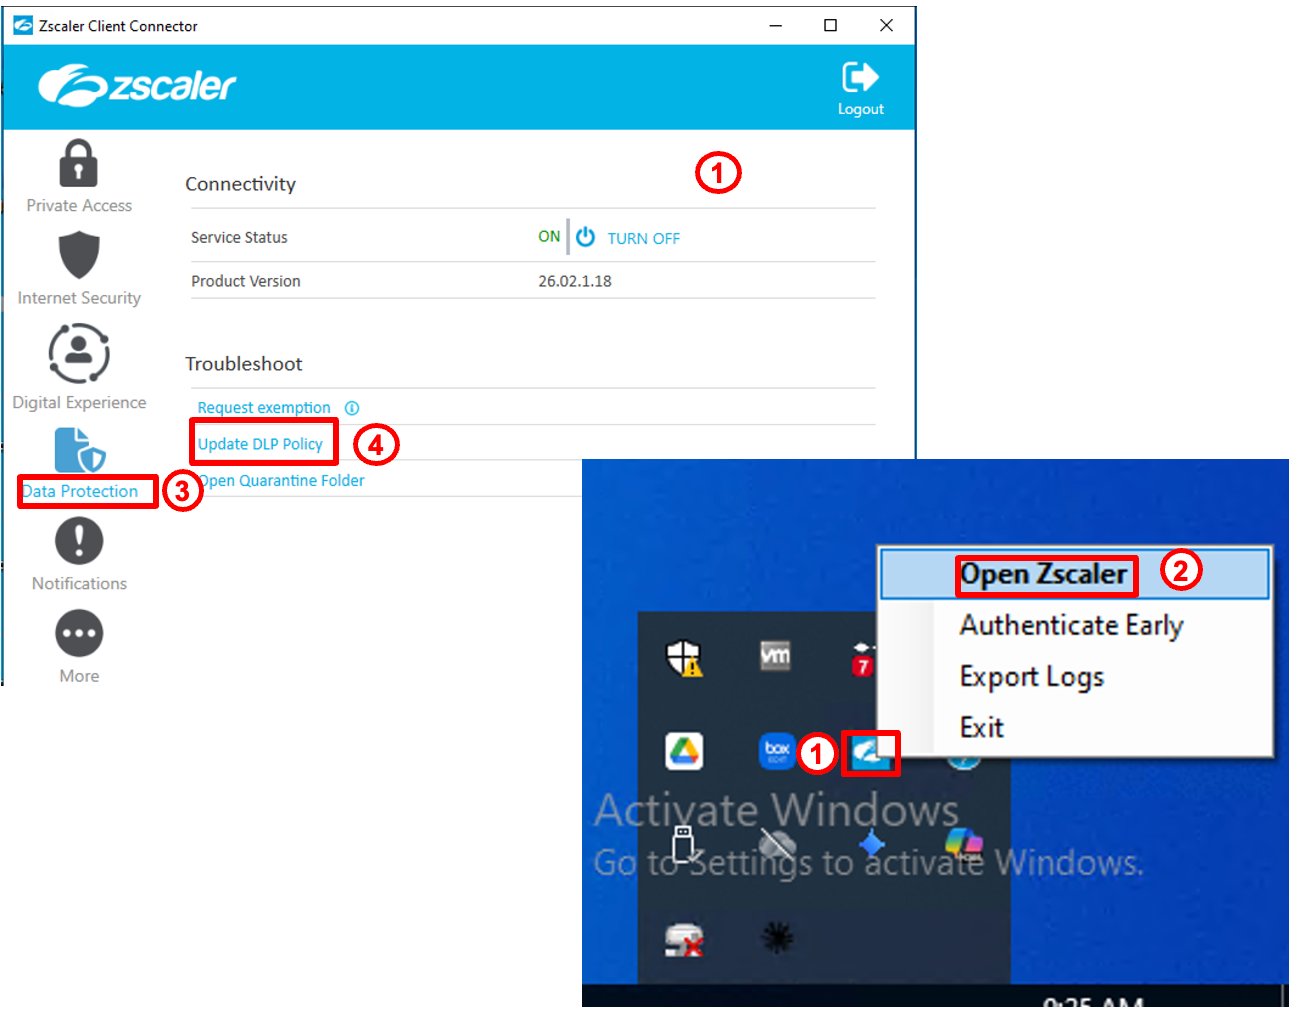
Right-click ZCC tray icon → Open Zscaler → Data Protection → Update DLP Policy
Step 4 — Kevin Opens the Document in Word and Selects Sensitive Content
Kevin opens Dataparity_Q2_2025_Workforce_Financial_Summary.docx in Microsoft Word — which is allowed, as Word is a sanctioned application. He selects the entire document so that the Credit Cards, ABA Bank Routing Number, and DP Project Code signals required by the engine are included.
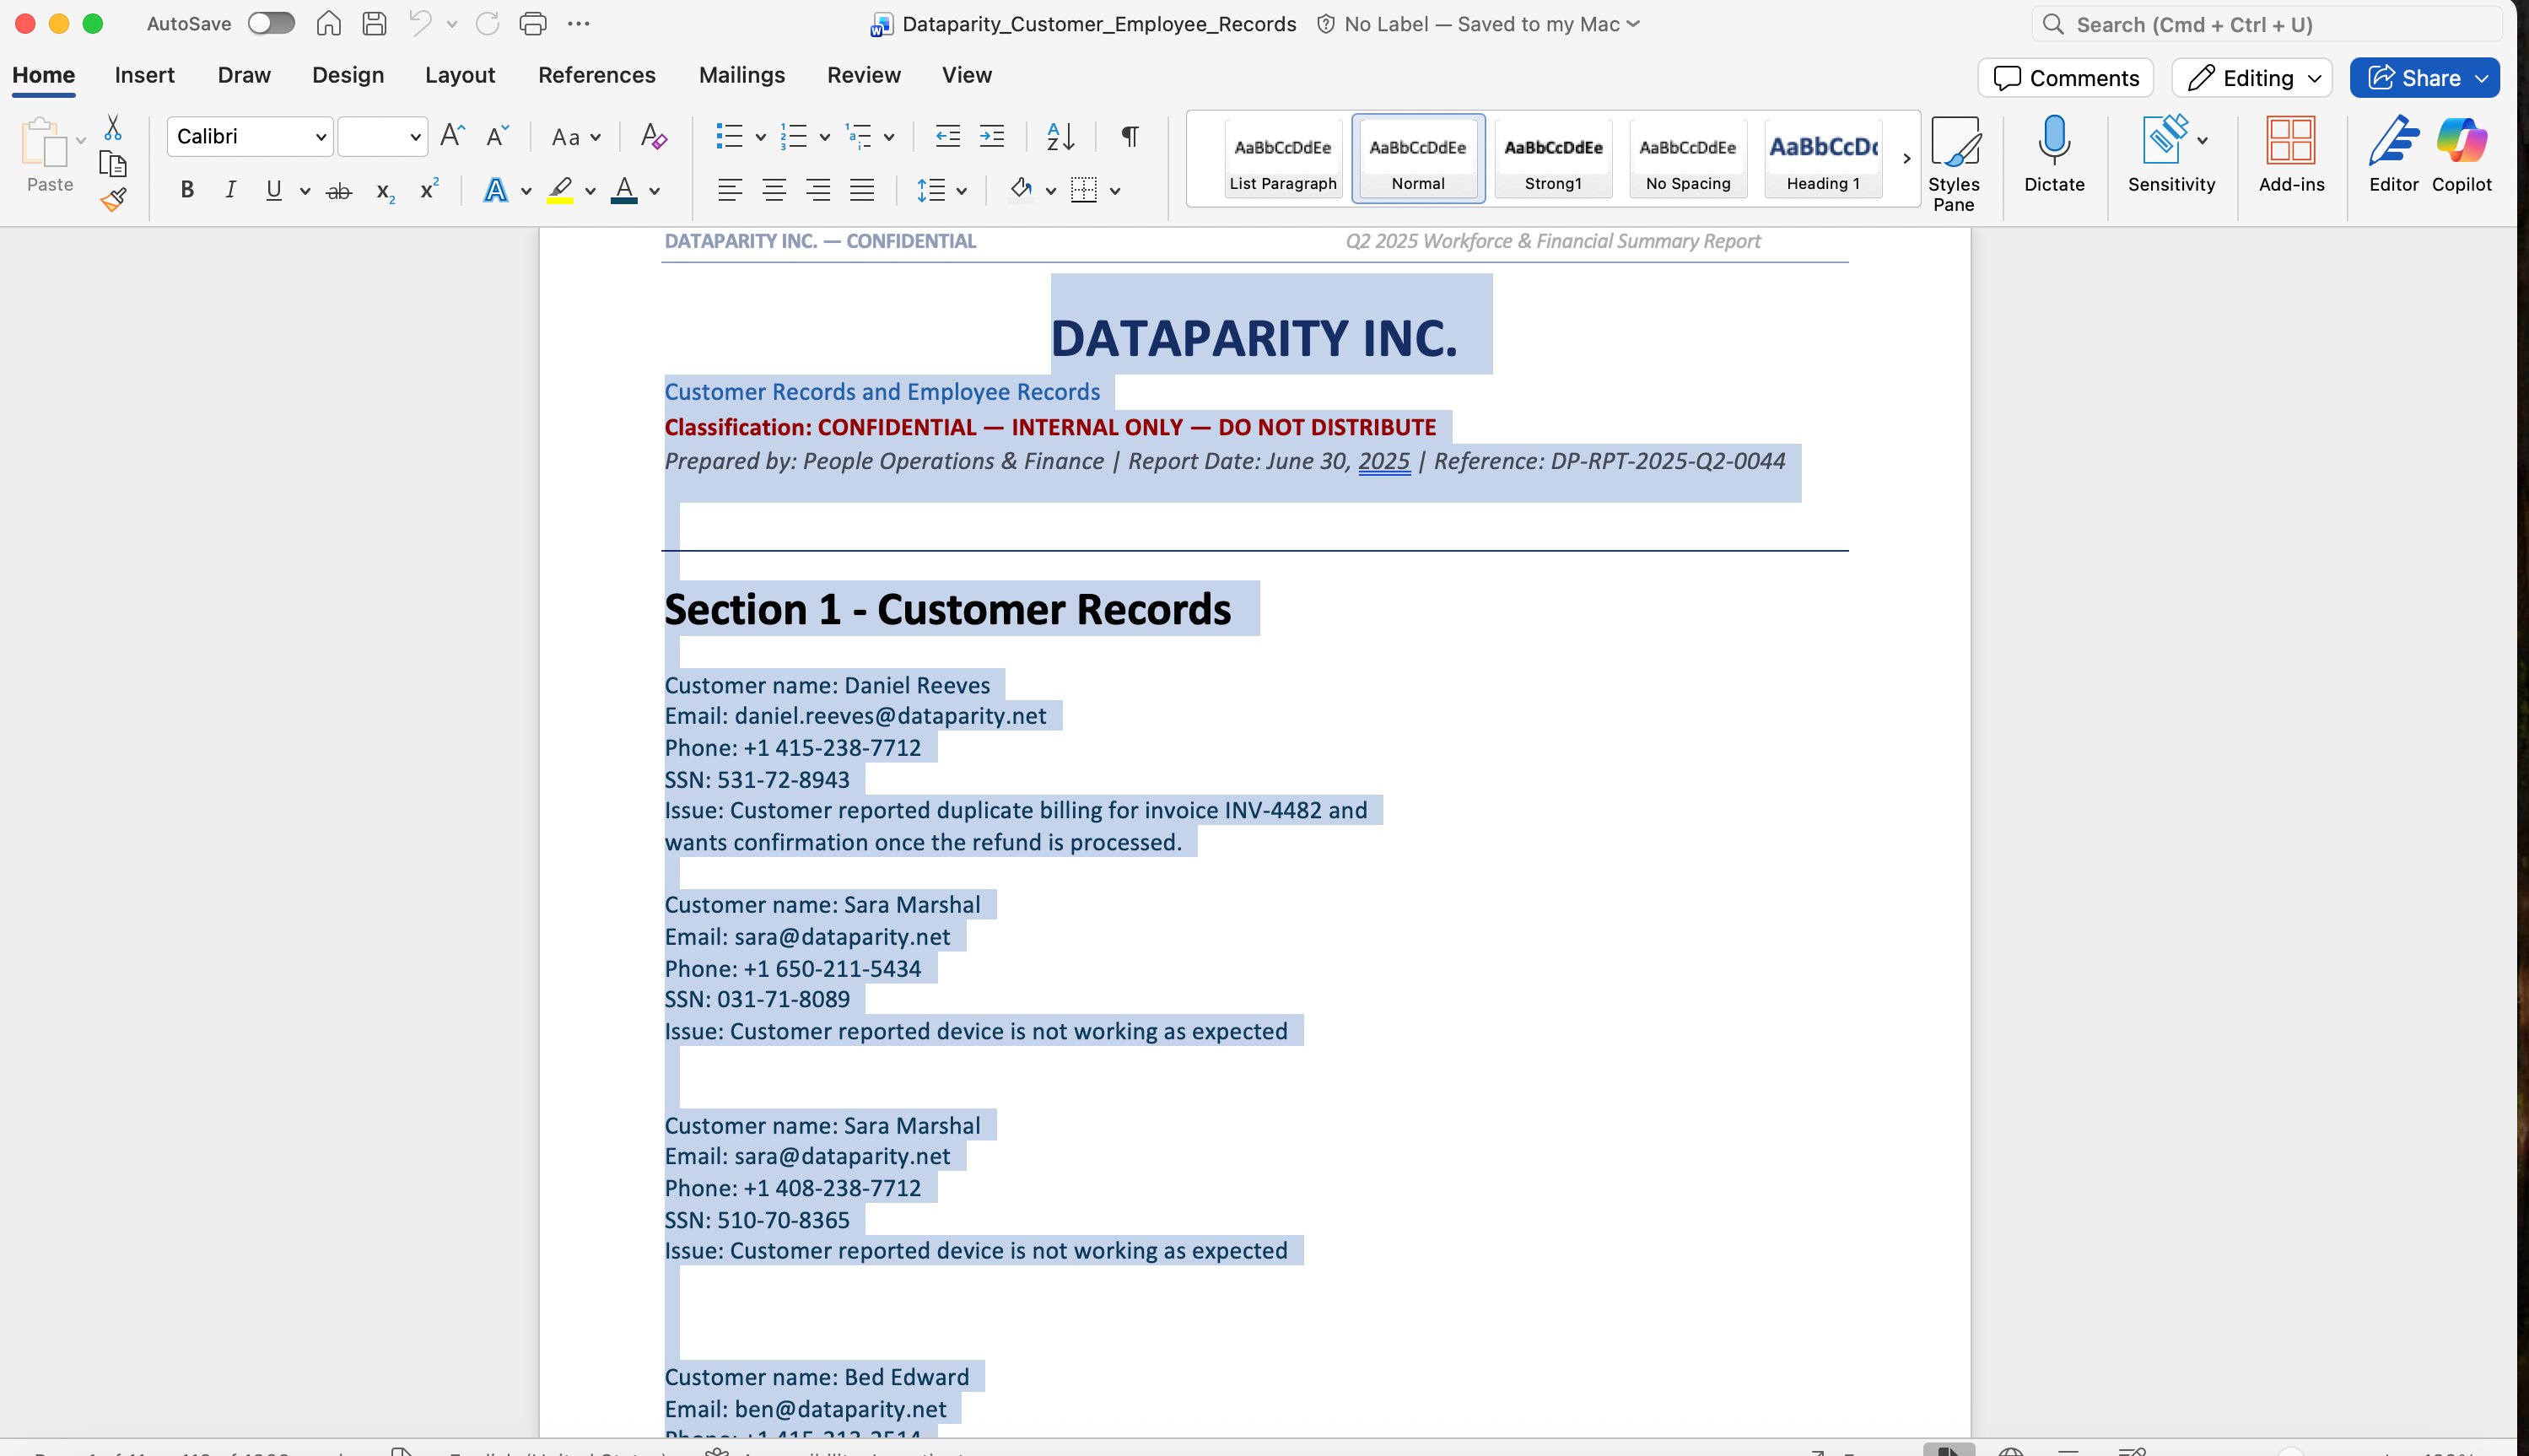
Kevin presses Ctrl+C to copy. He then opens Notepad++ and attempts Ctrl+V to paste.
Step 5 — Endpoint DLP Blocks the Paste
Instead of pasting, Kevin sees a Zscaler block notification:
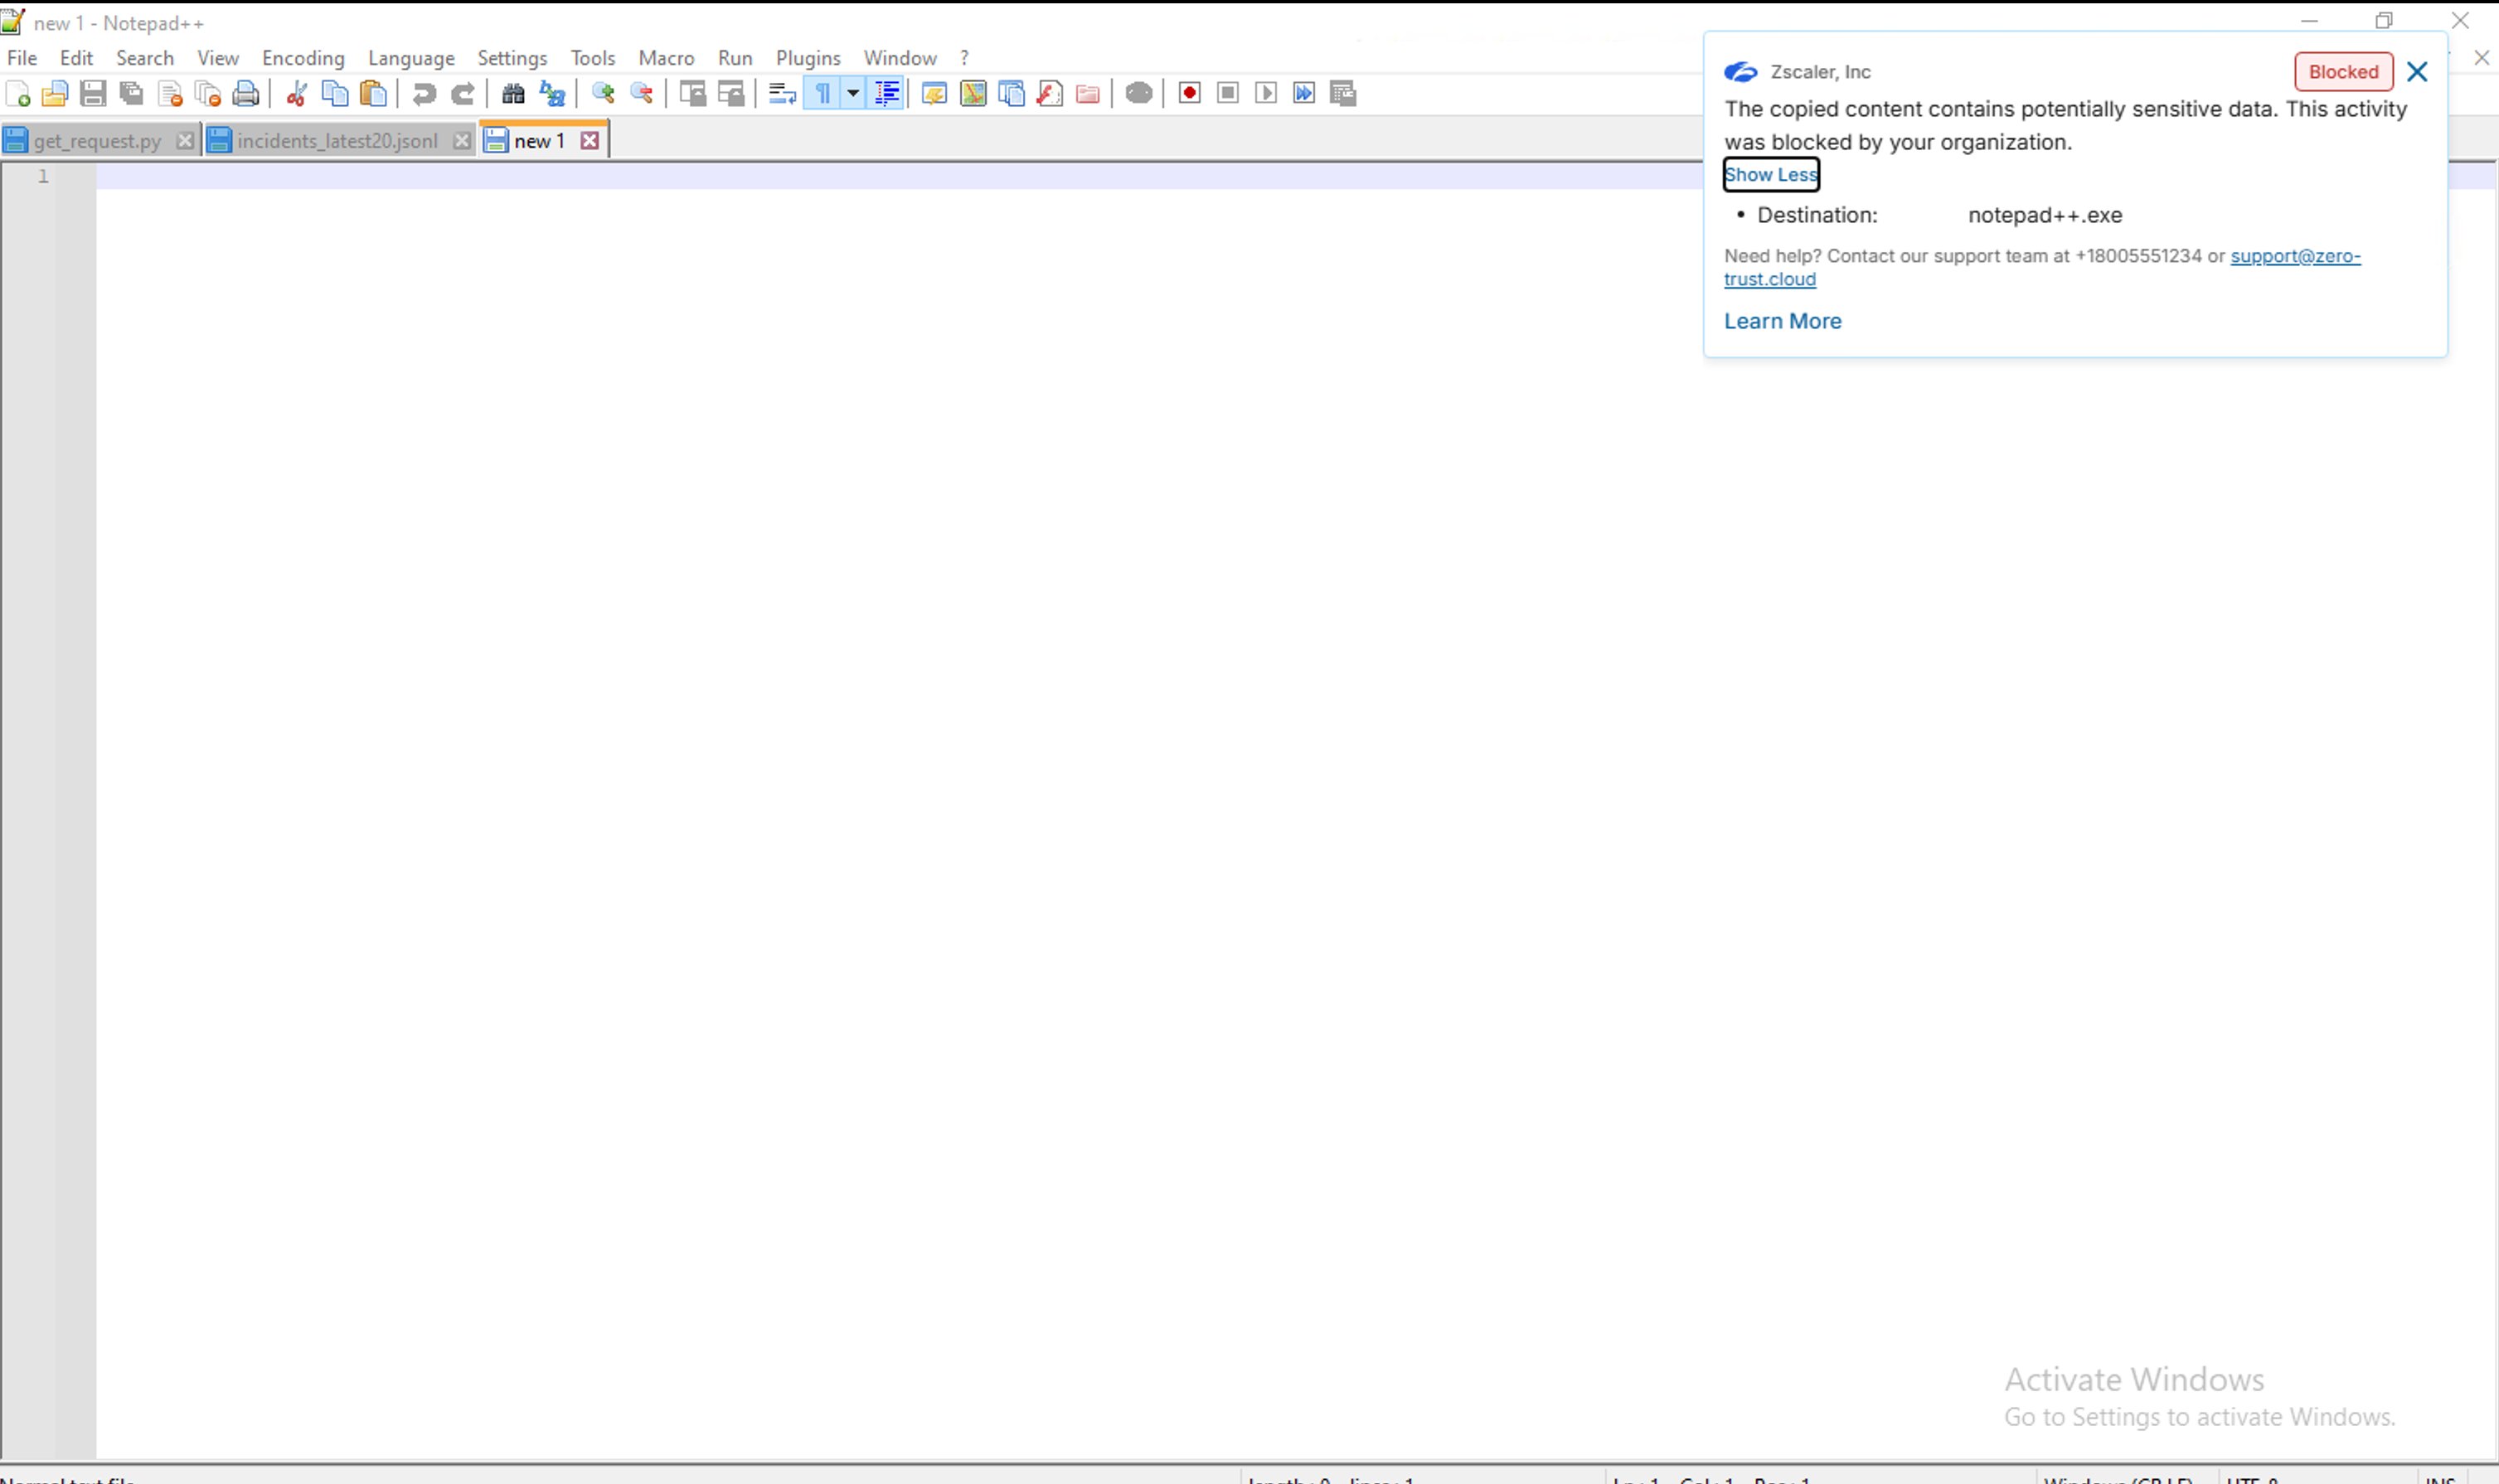
Blocked The copied content contains potentially sensitive data. This activity was blocked by your organization.
- Destination: notepad++.exe
Notepad++ remains empty — not a single character was pasted.
Step 6 — Navigate to Endpoint DLP Insights
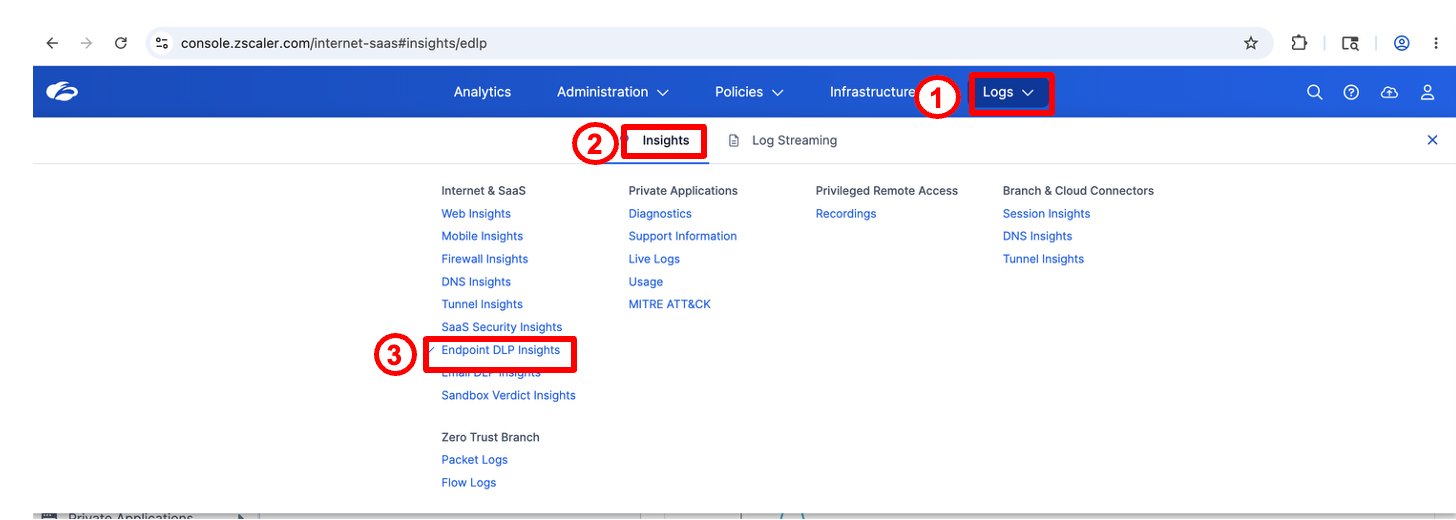
Step 7 — Review the Clipboard Violation Log
Apply filter: Channel = Clipboard → Run Query
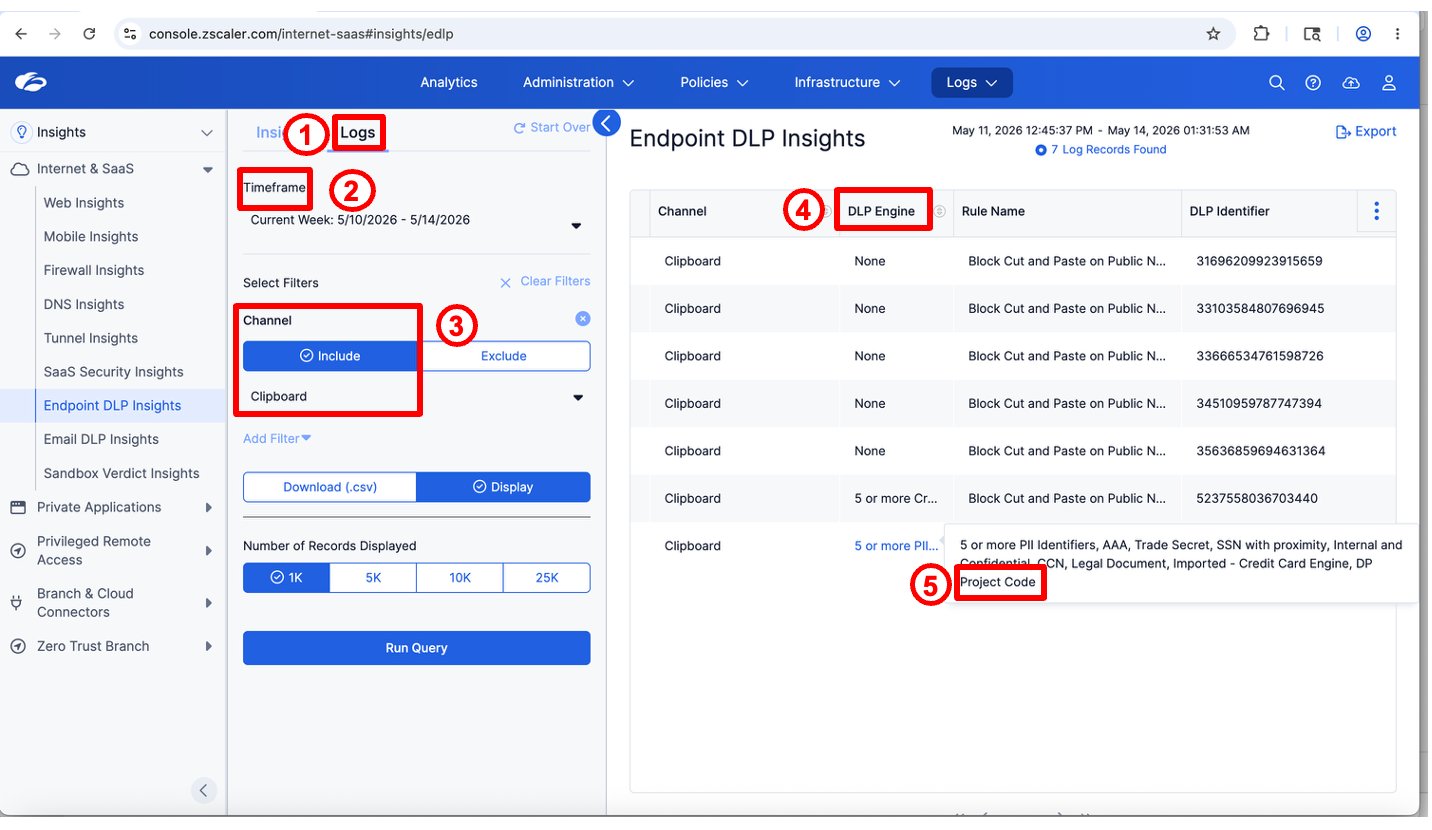
| Field | Value |
|---|---|
| Channel | Clipboard |
| Activity Type | Paste Text |
| DLP Engine | DP Project Code |
| Rule Name | Block Cut_n_Paste Sensitive Data (or the existing lab rule you updated) |
| Action Taken | Block |
Compare Activity Type: Paste Text (Task 2) vs Activity Type: File Read (Task 1). Two distinct OS-level events, two different channels, one unified Endpoint DLP Insights log — giving Alex a precise audit trail of exactly what Kevin attempted at each layer.
Kevin tried two OS-level evasion techniques after his network upload was blocked in Lab 6:
- Application File Access (Task 1) — tried to open the file directly in Notepad++. Blocked at the file read layer before any data reached the application.
- Clipboard (Task 2) — opened in Word (allowed), copied content, tried to paste into Notepad++. Blocked at the clipboard paste layer.
Neither attempt generated network traffic. Neither was visible to the proxy. Only Endpoint DLP — running at the OS layer — could intercept them.
Lab 8 moves to browser interactions using preconfigured Browser DLP policies. The Notepad++-scoped rules tested here do not cover every browser destination; Lab 8 demonstrates masking, sensitive-download blocking, and watermarking inside Chrome.
Lab Summary
In this lab:
- Alex reviewed the Notepad++ application definition in DLP Resources
- Alex created an Application File Access rule using the DP Project Code engine
- Alex pushed the updated policy to the endpoint via ZCC → Update DLP Policy
- Kevin right-clicked
Dataparity_Q2_2025_Workforce_Financial_Summary.docx→ Edit with Notepad++ → blocked at OS file read layer - Alex confirmed Activity Type: File Read in Endpoint DLP Insights
- Kevin opened the file in Word (allowed), copied sensitive content, attempted to paste into Notepad++ → blocked at OS clipboard layer
- Alex confirmed Activity Type: Paste Text in Endpoint DLP Insights — two distinct channels, one unified log
Key Takeaway: Endpoint DLP closes the OS-layer gaps that proxy and browser DLP cannot cover. Application File Access and Clipboard are two complementary channels that together prevent both direct file extraction and content copy/paste exfiltration — entirely off-network.
Labs 6 and 7 demonstrated network-upload, application file-access, and clipboard controls. Lab 8 uses preconfigured Browser DLP policies to mask sensitive values before submission, block sensitive PDF downloads from a website, and watermark a document viewed in Chrome.
Browser-Based DLP does not replace Inline Web DLP or Endpoint DLP. Each operates at a different control point and covers a different threat surface:
| Control | Where it operates | What it covers |
|---|---|---|
| Inline Web DLP (Lab 6) | Network proxy | Data leaving via HTTP/S uploads |
| Endpoint DLP (Lab 7) | OS / agent layer | Application File Access and Clipboard rules scoped to Notepad++ |
| Browser-Based DLP (Lab 8) | Inside the browser | GenAI prompt masking, sensitive-file download blocking, and browser-viewed document watermarking |
These controls complement one another. Coverage depends on supported applications, platforms, inspection settings, and policy scope.
All tasks in this lab must be performed from the lab VM using Google Chrome. The Zscaler Browser DLP Chrome extension must be active. Complete the prerequisite login steps below before starting Task 1.
Prerequisite — Log In to the Chrome Extension
On the same CloudShare VM, authenticate the Chrome extension with the SDC Admin credentials listed in Pre-Requisites for Module 2. This extension login is separate from the Student Admin login used by ZCC. Lab 8 uses preconfigured Browser DLP policies; it does not require the DP Project Code engine you created in the Lab Tenant.
Prereq Step 1 — Open the Extension Sign-In Website
Open Google Chrome on the lab VM and go to enterprise.onsqrx.com.
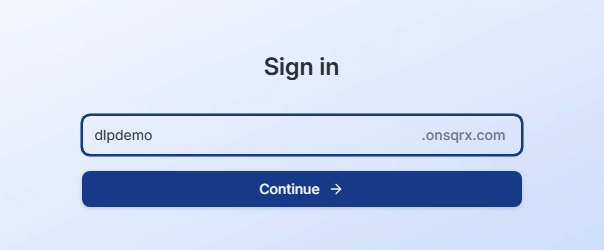
Prereq Step 2 — Enter the Tenant Identifier
Enter dlpdemo as the tenant identifier and click Continue.
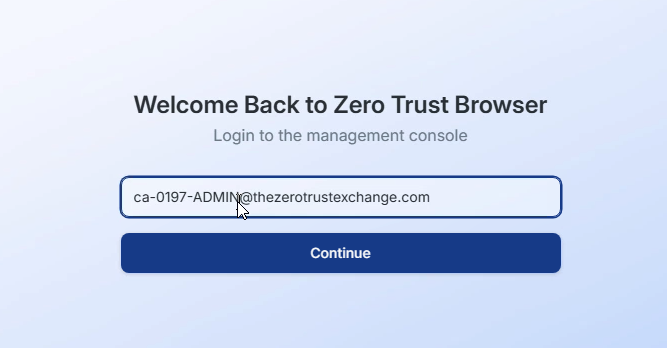
Prereq Step 3 — Enter the Lab User ID
Enter the Admin Username from CloudShare → Credentials → SDC Credentials.
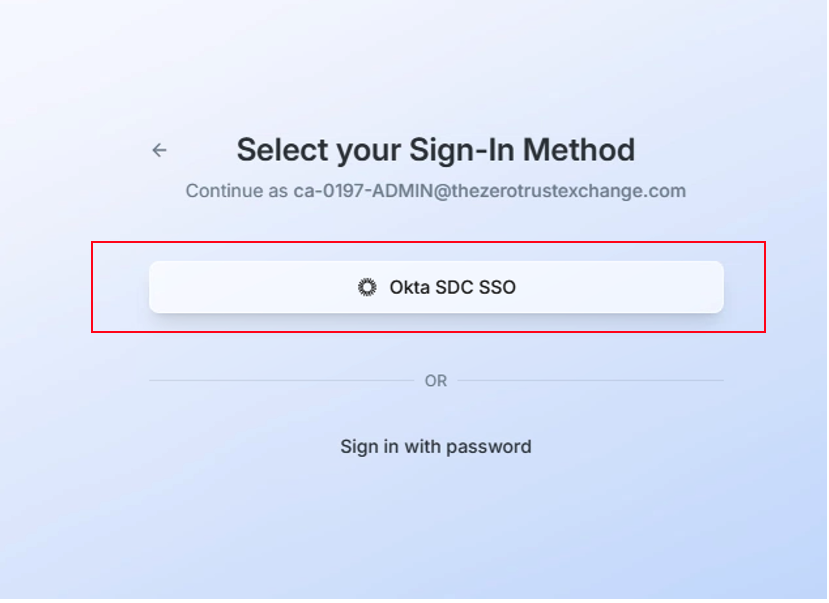
Prereq Step 4 — Select Okta SSO
Click Okta SDC SSO to proceed to identity provider authentication.
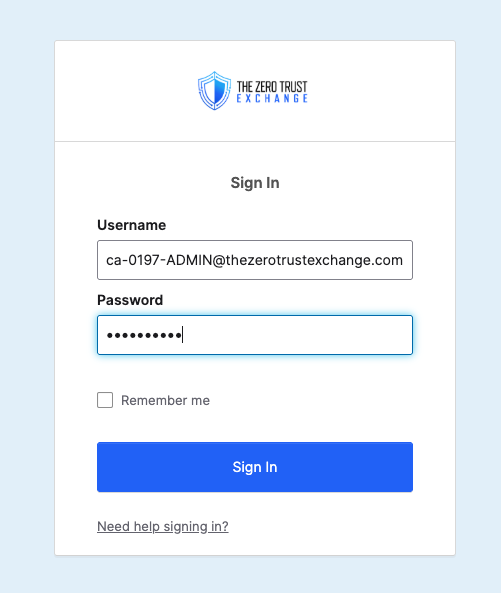
Prereq Step 5 — Complete IDP Authentication
Complete the identity-provider login with the same SDC Admin Username and its assigned password.
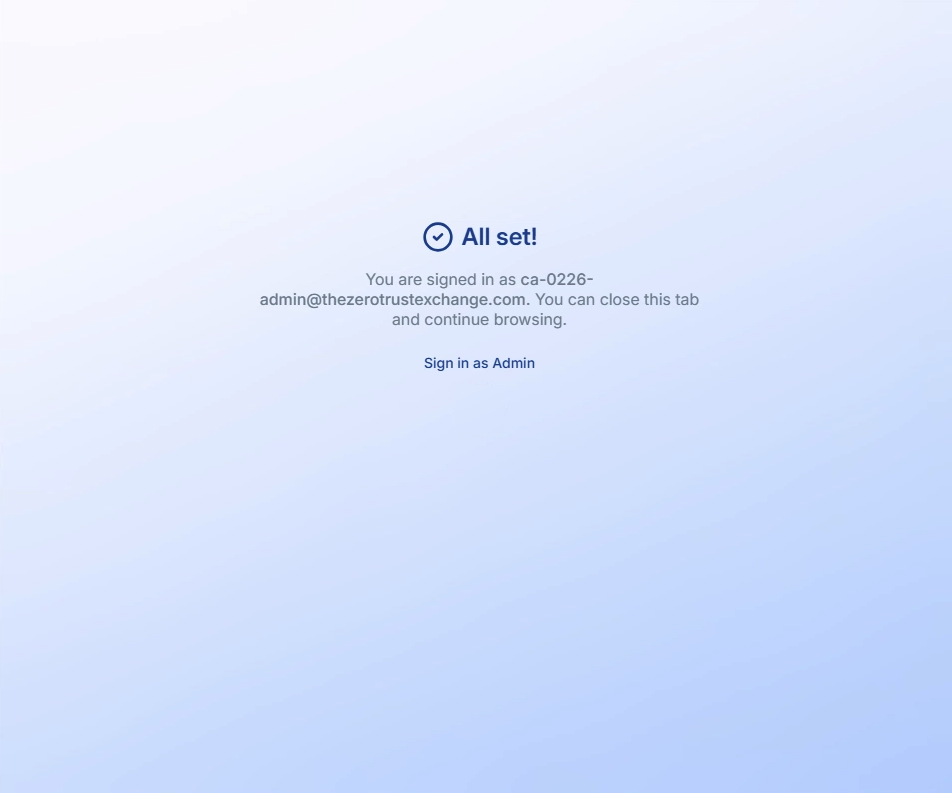
After signing in with your SDC Admin credentials, you will see the "All set!" confirmation screen. This signs you in to the installed Browser DLP extension. Do not click "Sign in as Admin" — it is not required for this lab. Close this tab and return to the lab guide.
Task 1 — Mask Sensitive Values Before GenAI Submission
Demonstrate how Browser-Based DLP intercepts sensitive data typed or pasted into a GenAI prompt and masks it before submission — protecting data that never touches the network layer.
Steps
Kevin opens ChatGPT in Chrome and pastes the following sample customer record. Use this supplied example rather than real customer data:
📋 Content to paste into the ChatGPT prompt:
Customer name: Daniel Reeves
Email: daniel.reeves@acme-corp.com
Phone: +1 415-238-7712
SSN: 531-72-8943
Issue: Customer reported duplicate billing for invoice INV-4482 and
wants confirmation once the refund is processed.
As soon as Kevin pastes the content, the Browser-Based DLP extension detects the sensitive values — SSN, email, phone number — and masks them inline before the prompt is submitted. Kevin is notified that sensitive content has been redacted.
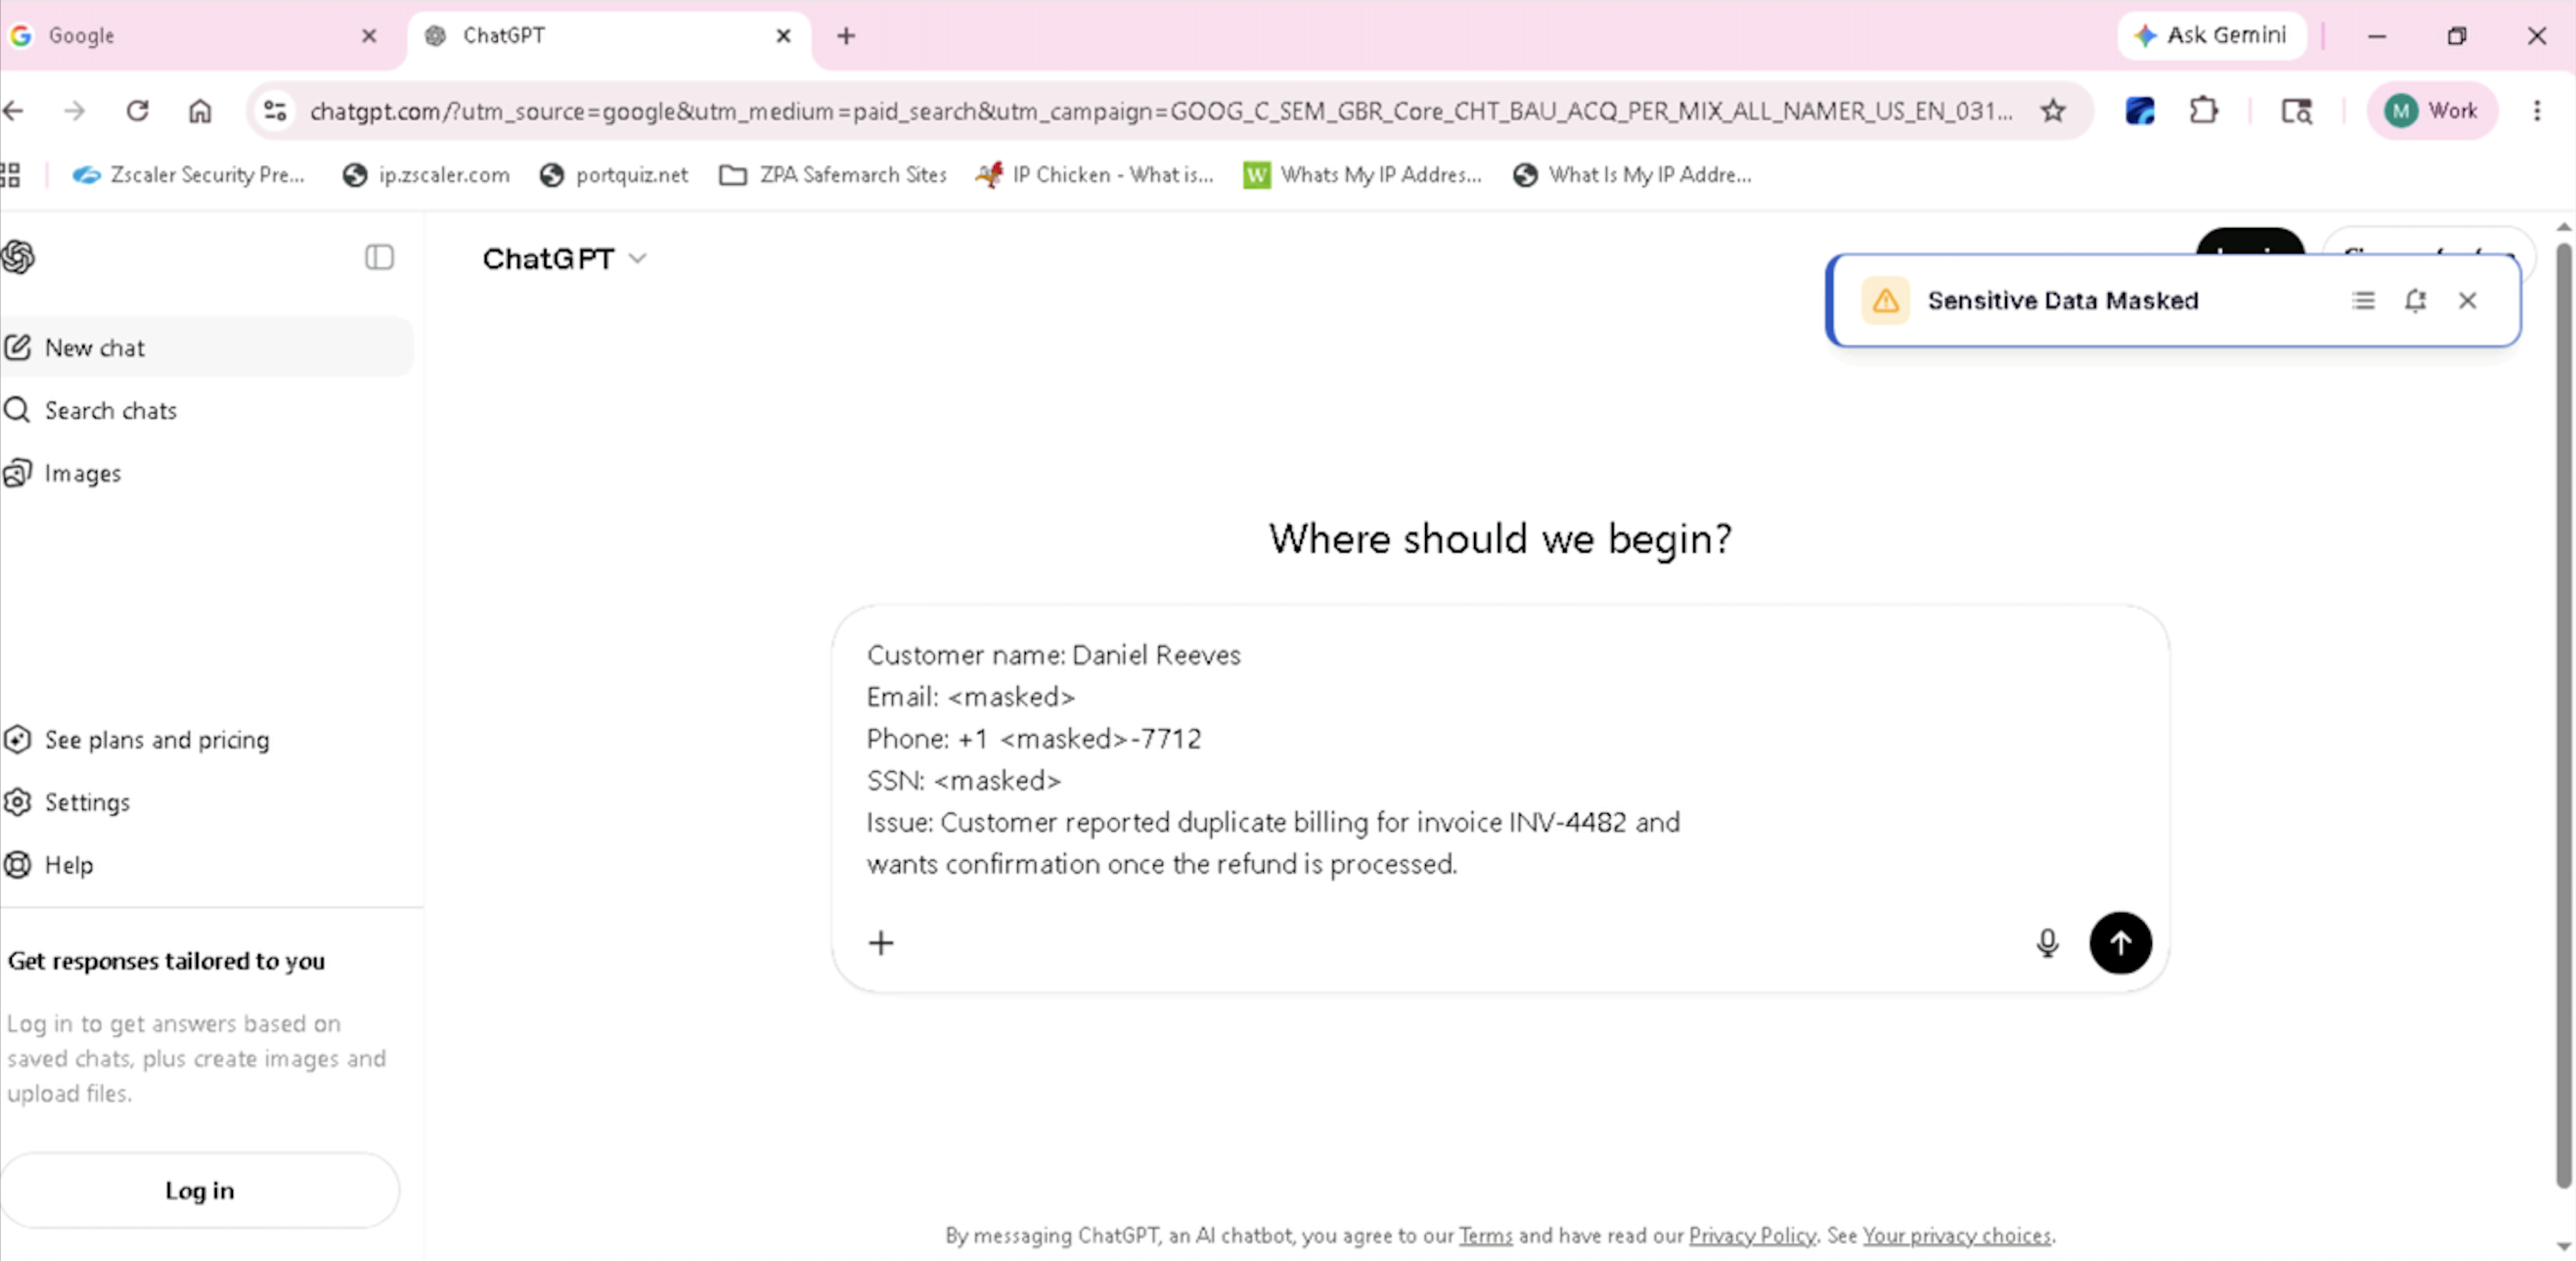
Browser DLP masks values at the input field before submission. Inline DLP can inspect supported outbound traffic when SSL inspection and policy scope apply, but it does not provide the same in-page masking experience.
Use the application and input surfaces covered by the configured Browser DLP policy.
Task 2 — Block Sensitive File Downloads
Attempt to download a PDF containing sensitive sample data and verify that the browser policy blocks it.
Step 1 — Select the Sample and Download Format
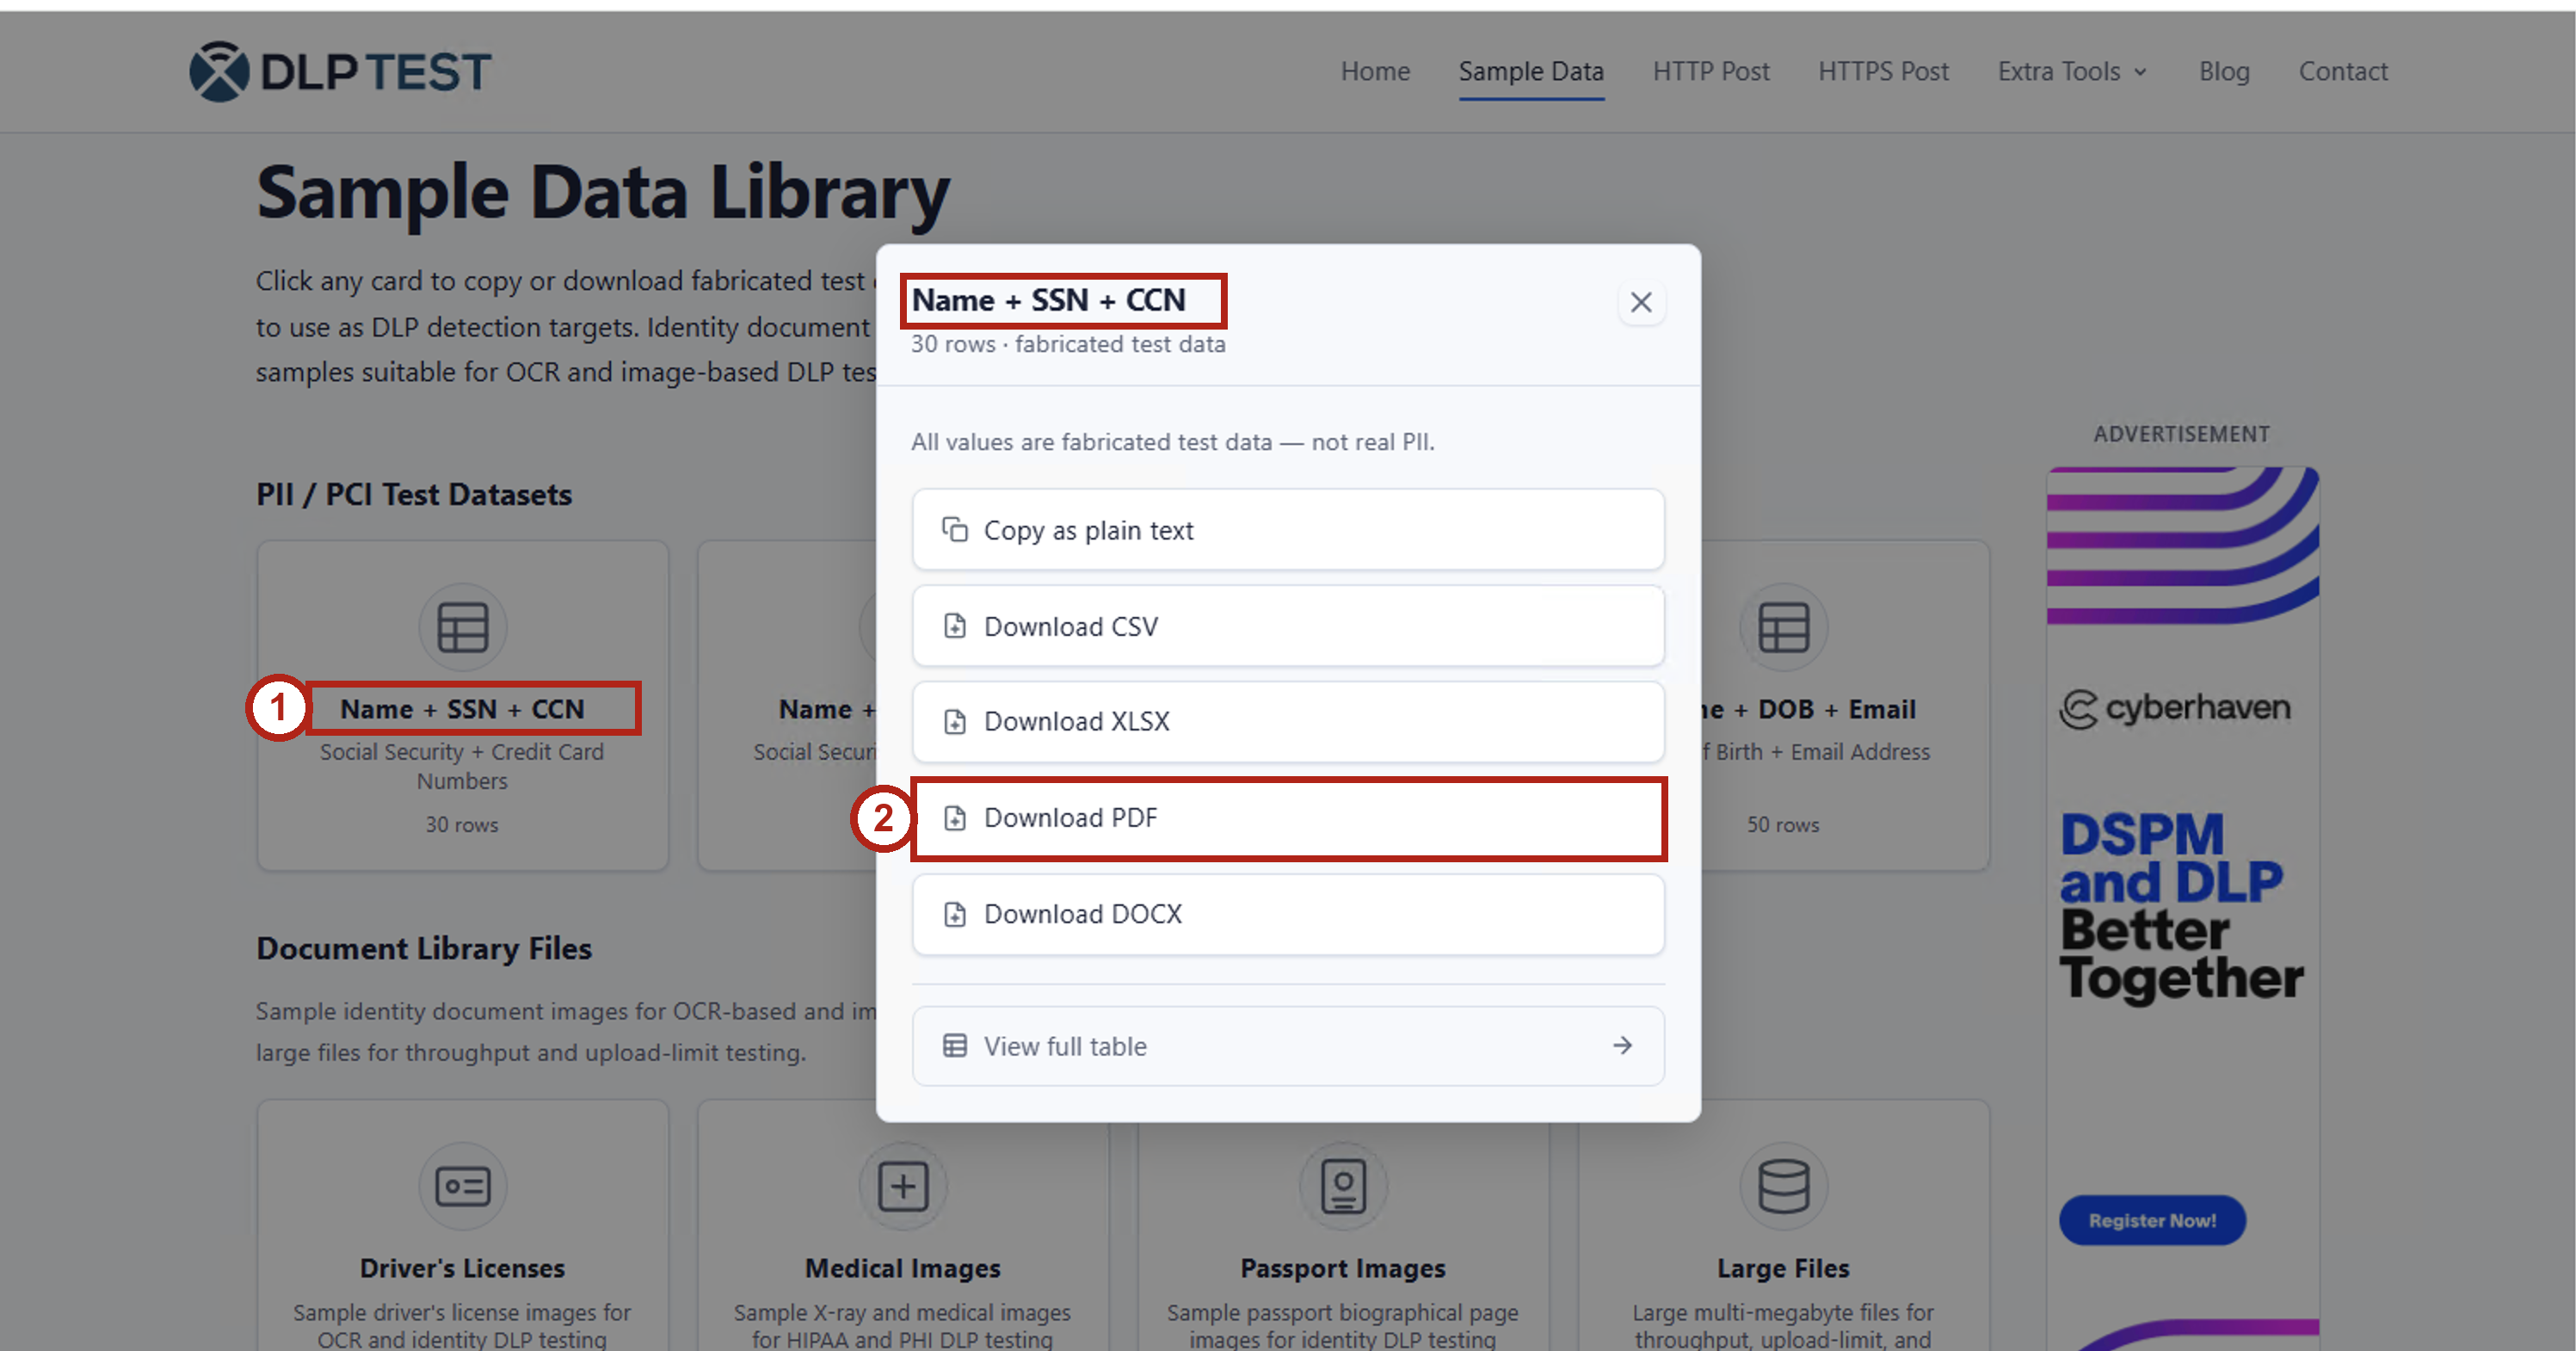
- In Chrome on the lab VM, open https://dlptest.com/sample-data/.
- Under PII / PCI Test Datasets, select Name + SSN + CCN (callout 1). This dataset contains fabricated names, Social Security numbers, and credit card numbers.
- In the dialog, click Download PDF (callout 2).
Step 2 — Verify the Download Is Blocked
Confirm that the Download Blocked notification appears (callout 3) with the message:
File Download has been blocked based on policy
The screenshot also shows dlptest-name-ssn-ccn.pdf marked Removed in Chrome's downloads list. The expected outcome is that the PDF is not available as a successful download.
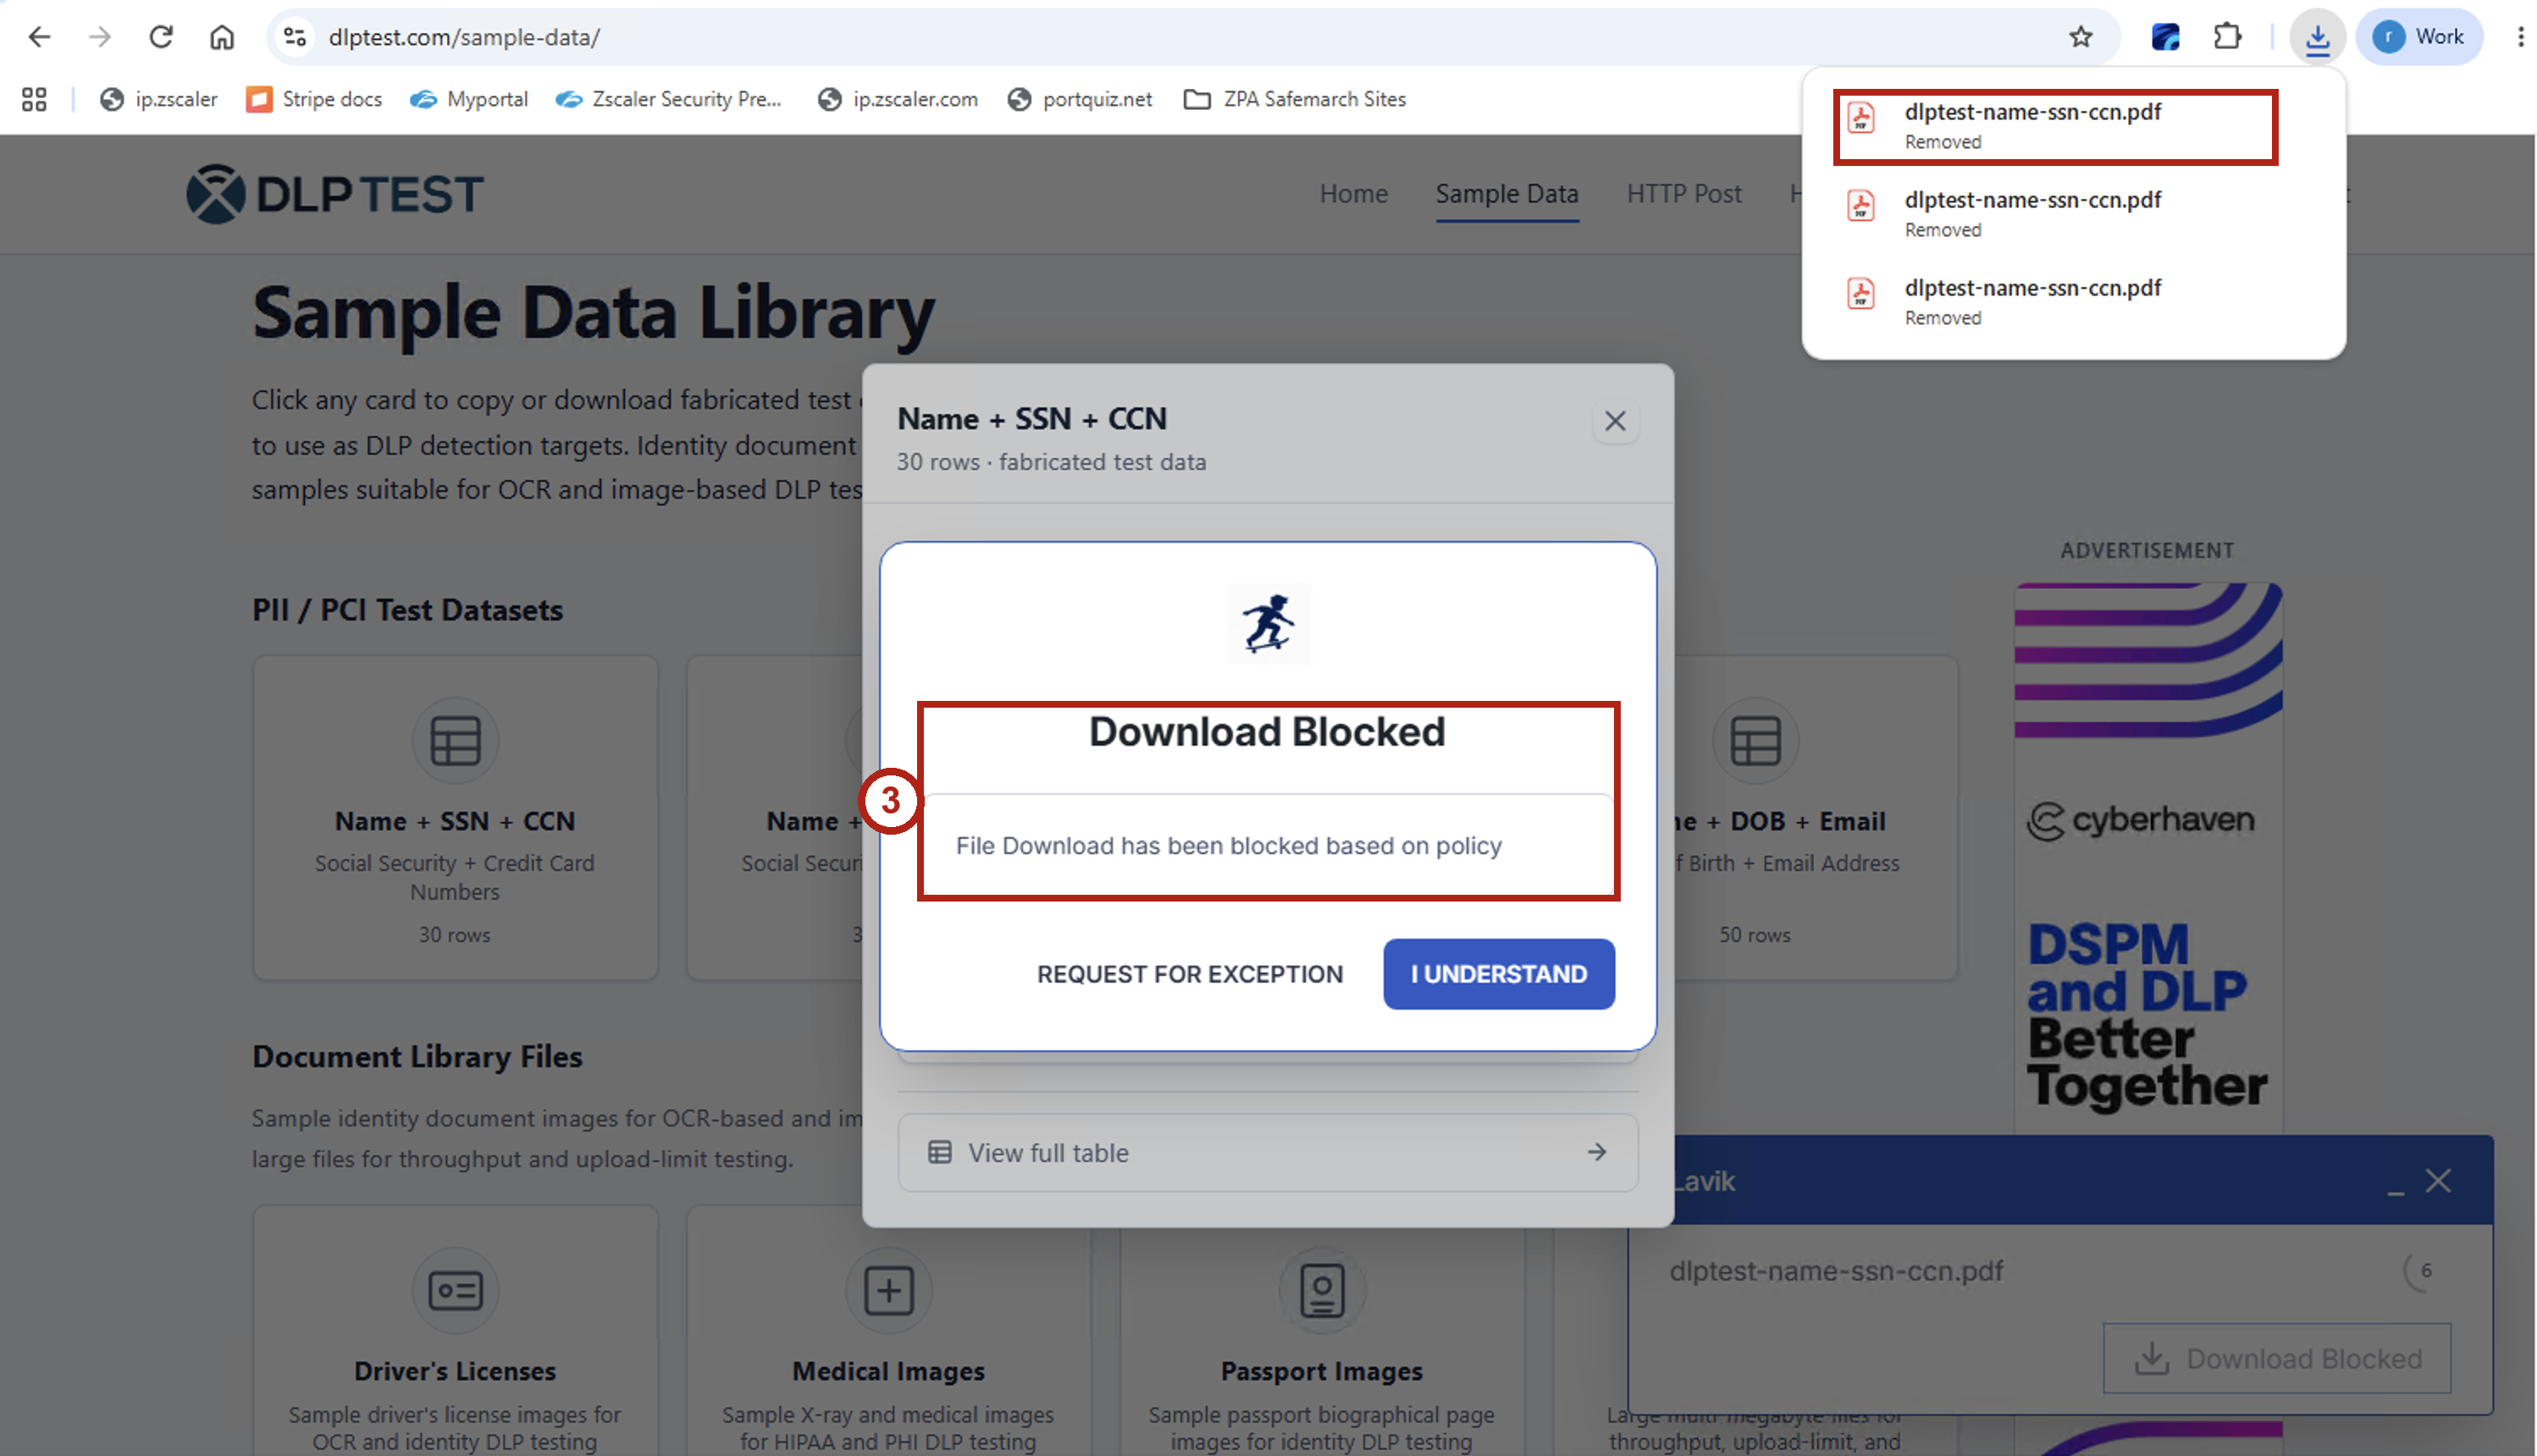
Select I UNDERSTAND to dismiss the notification. If the file downloads successfully or only a generic browser error appears, confirm the Browser DLP extension is authenticated and ask your facilitator to check the demo policy.
Task 3 — Dynamic Watermark with Viewer Identity
Demonstrate how Browser-Based DLP dynamically watermarks sensitive documents viewed in the browser with the viewer's identity — creating a visual deterrent and forensic trail without altering the source file.
Steps
Kevin opens the following sensitive Dataparity document in Chrome — this document has been tagged for dynamic watermarking by the Browser-Based DLP policy:
📋 Open this link in Chrome on the lab VM:
docs.google.com/document/d/1hY6dxddc24anjf1U8GsnVtQwYvvPxasM59_NR35toQA/edit
As soon as the document renders in the browser, the extension overlays a dynamic watermark containing Kevin's identity — user name, email, and timestamp — across the document view.
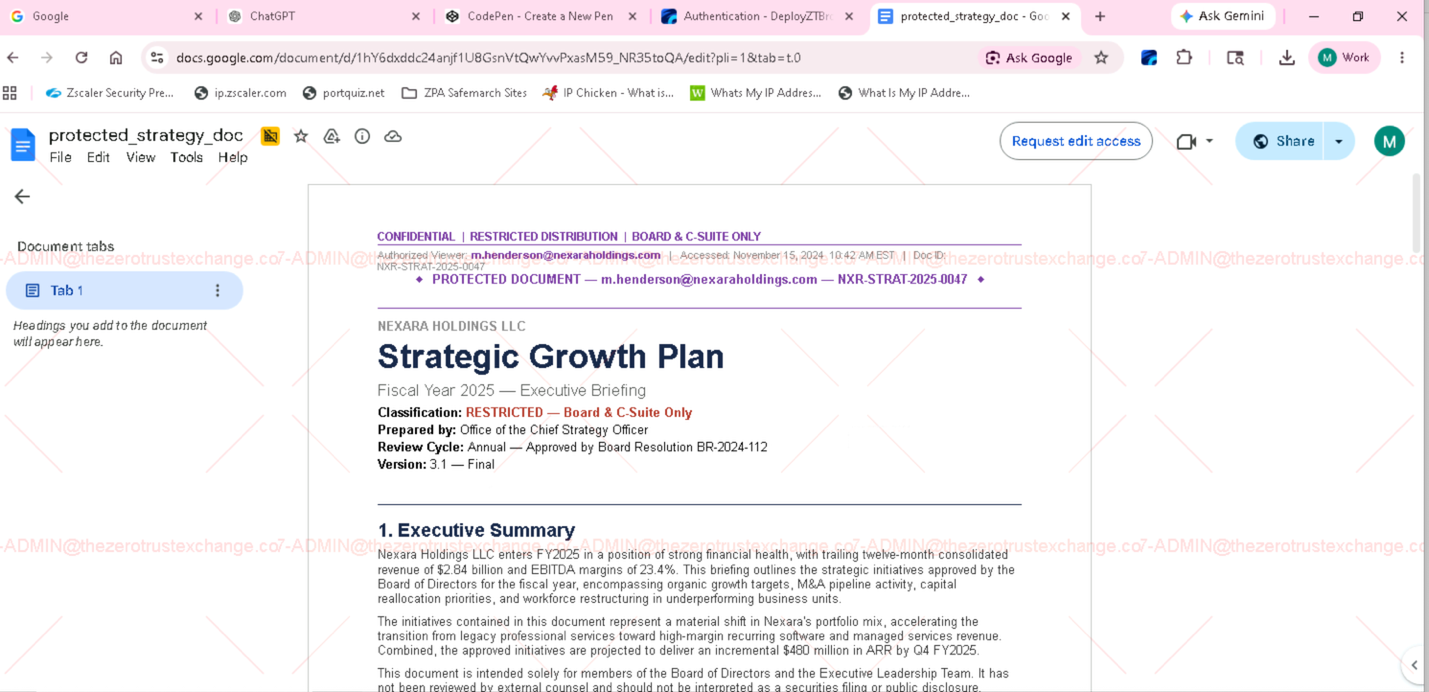
The watermark is applied to the browser view, not to the source file. It identifies the viewer in the displayed document; this exercise does not establish that a downloaded copy retains the watermark.
Watermarking is a visual deterrent. It is not a replacement for access, download, or data-movement controls.
- Task 1 masked content before submission to ChatGPT. How would you handle a use case where a user legitimately needs to ask an AI assistant about a customer record — for example, a support agent using an internal AI tool?
- Task 2 blocked a sensitive PDF download. How does preventing data from being saved locally complement the upload and endpoint controls tested in Labs 6 and 7?
- Task 3 showed a deterrent watermark. Can you think of a scenario where watermarking alone is insufficient and a Block action would be required instead?
- Browser-Based DLP requires a Chrome extension. How would you handle employees using Firefox, Edge, or Safari — and what does that mean for your coverage model?
The controls are complementary. Lab 6 tested an inspected web upload, Lab 7 tested file access and clipboard paste into Notepad++, and Lab 8 demonstrated browser masking, sensitive-download blocking, and watermarking with preconfigured policies.
Next, return to the Enterprise Tenant for Lab 9 to review separate pre-populated incidents and existing response workflows.
Module 3 Overview
Confirm Tenant Switch
Return to the Enterprise Tenant (Tenant 1). In your assigned CloudShare environment, open Credentials → SDC Credentials and use the Admin Username and Password to sign in at sdc.zslogin.net. Do not use the Module 2 Student Admin credentials. This module is read-only: do not send notifications, change incident state, escalate, or configure workflows.
After Alex's policy work and Kevin's tests, Priya explores a separate, pre-populated incident queue in Zscaler Workflow Automation (ZWA). Review incident evidence, existing user notifications and state changes, available actions, and a workflow template preview. The Lab 9 example is an Inline incident for an attachment/post at dlptest.com under CC SSN HIPAA Block — not the student's Lab 6 or 7 document or DP Project Code policy. Allow 20 minutes for Lab 9 and 10 minutes for the knowledge check.
Module Objectives
| Question | Capability |
|---|---|
| How does Priya find and review incidents? | ZWA Incident Dashboard |
| How does she assess evidence and trigger data? | Incident Details & Violation Content |
| What status, priority, and prior actions are recorded? | Incident Metadata & State Changes |
| What notifications have already been sent, and what response is recorded? | User Notifications History |
| Which response options are available, without executing them? | Actions Menu Exploration |
| How could notification and escalation be automated? | Workflow Template Preview |
Lab in This Module
Triage DLP incidents in Workflow Automation — from queue navigation to incident drill-down to automated response templates.
Background
Return to the Enterprise Tenant using CloudShare → Credentials → SDC Credentials, as described in Lab 1. Keep the Experience Center Nav 1.0 interface for the navigation shown here.
As Priya, investigate a pre-populated inline DLP incident in Workflow Automation (WFA). Review its file metadata, policy, notifications, and state-change history to understand how incidents are handled.
Incident counts, dates, and available records may differ from the screenshots. If the example record is unavailable, select another Inline incident and review the same fields.
Task 1 — Navigate to Workflow Automation and Open the Incidents Queue
Workflow Automation is accessed from the main Zscaler console navigation bar. Follow the steps below to reach the Incidents list.
Steps
Step 1 — Open Administration → Workflow Automation
From the top navigation bar, click Administration. In the drop-down, locate the Workflow Automation section on the far right and click it to switch context.
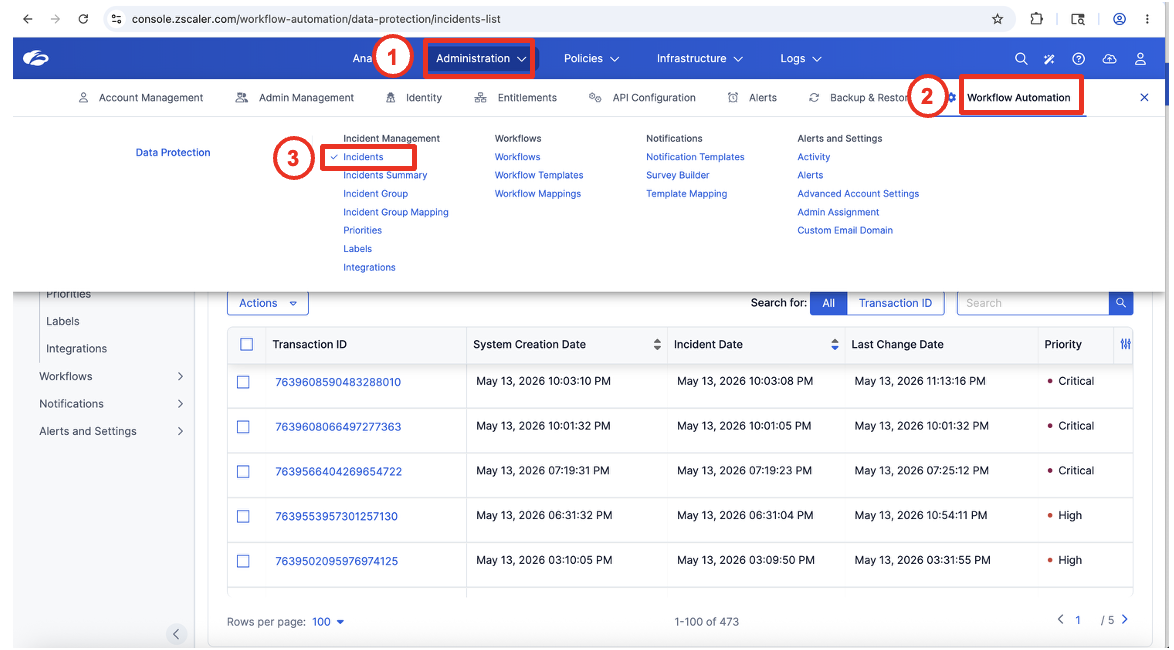
Callout 1 — Click Administration in the top nav. Callout 2 — Select Workflow Automation from the sub-menu. Callout 3 — Under Incident Management, click Incidents.
Step 2 — Review the Incidents Landing Page
You are now on the Incidents list. It brings together incident records from the sources integrated with this tenant.
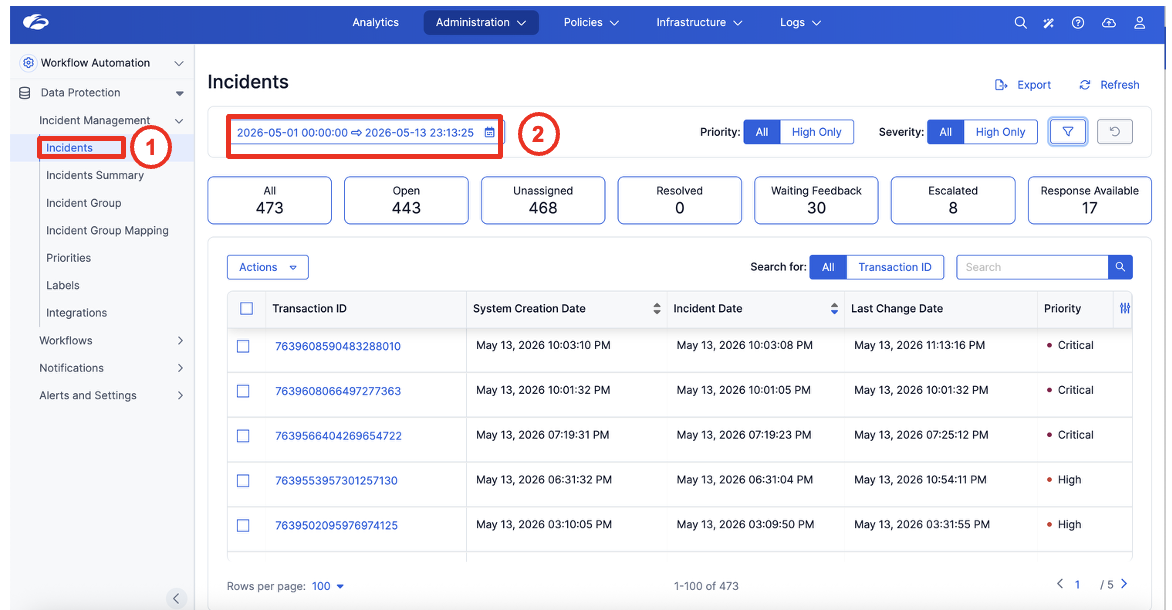
Observe the following on this page:
| Element | What it shows |
|---|---|
| Date Range | Incidents from 2026-05-01 through today |
| All: 473 | Total incidents in the selected window |
| Open: 443 | Incidents not yet resolved |
| Unassigned: 468 | Incidents with no assigned analyst |
| Waiting Feedback: 30 | Incidents pending user justification |
| Escalated: 8 | Incidents flagged for senior review |
| Response Available: 17 | Incidents where an automated response is ready |
The Priority and Severity quick filters at the top right let you surface Critical and High incidents instantly without opening the advanced filter panel.
Task 2 — Filter by Source DLP Type
Use the Filters panel to isolate the available incident sources relevant to your investigation.
Steps
Step 1 — Open the Filters Panel
Click the filter icon (funnel) at the top right of the Incidents toolbar.
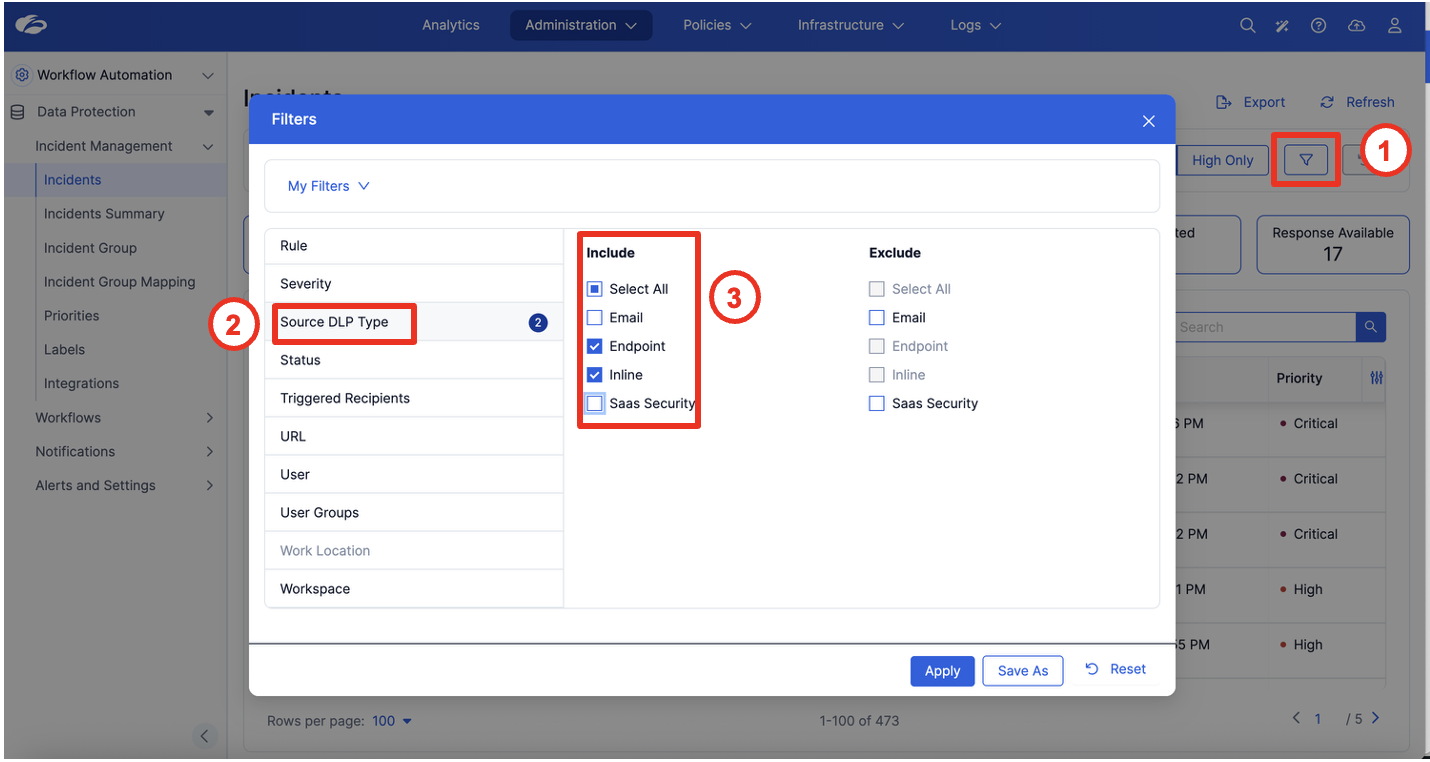
Callout 1 — Click the filter funnel icon. Callout 2 — Select Source DLP Type from the filter category list. Callout 3 — Check Endpoint and Inline under Include to see violations from those two channels side by side.
Available Source DLP Types:
- Email — incidents from ZIA Email DLP
- Endpoint — incidents from Zscaler Client Connector endpoint DLP agent
- Inline — incidents from ZIA inline proxy (web traffic)
- SaaS Security — incidents supplied by integrated SaaS data-protection sources
Task 3 — Drill Into an Incident: Full Triage Walk-Through
Now open one of the inline incidents to see the complete forensic picture Zscaler captures.
Steps
Step 1 — Open the Incident Details Page (Overview)
Click on Transaction ID 53-1282-7639608590483288010 — the top-of-queue Critical incident — to open its full detail view.
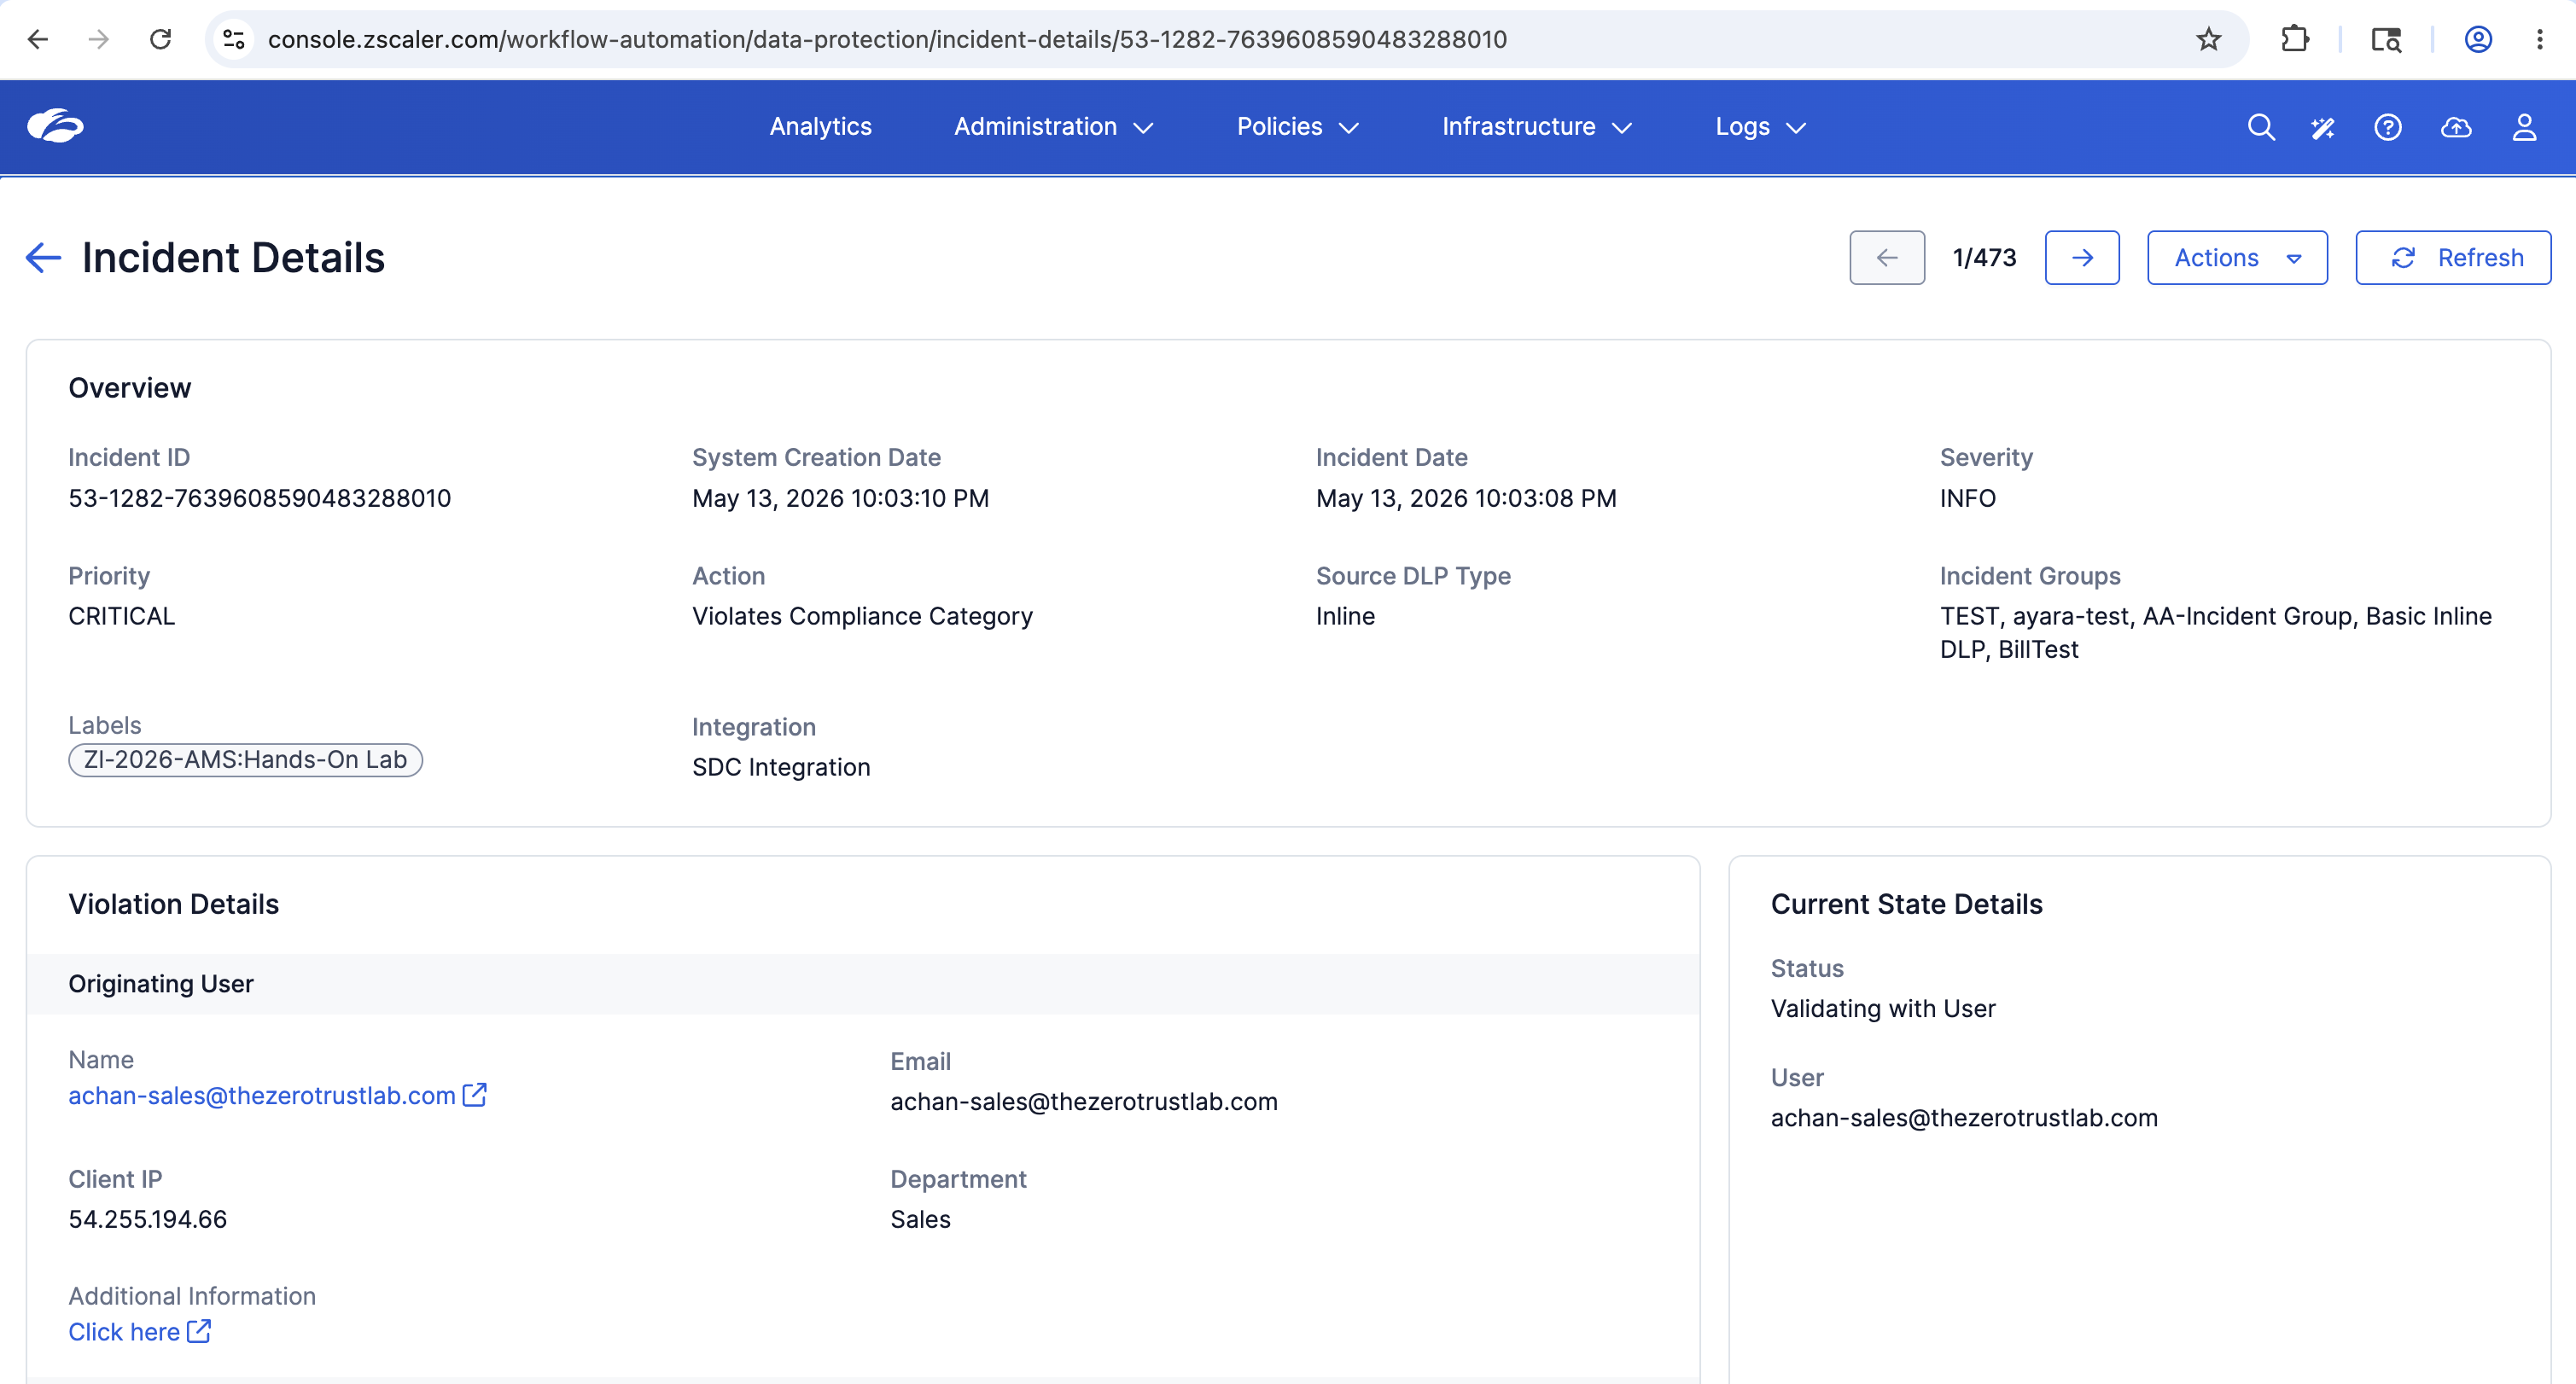
Read each section of the Overview panel:
| Field | Value |
|---|---|
| Incident ID | 53-1282-7639608590483288010 |
| System Creation Date | May 13, 2026 10:03:10 PM |
| Incident Date | May 13, 2026 10:03:08 PM |
| Severity | INFO |
| Priority | CRITICAL |
| Action | Violates Compliance Category |
| Source DLP Type | Inline |
| Incident Groups | TEST, ayara-test, AA-Incident Group, Basic Inline DLP, BillTest |
| Labels | ZI-2026-AMS:Hands-On Lab |
| Integration | SDC Integration |
Scroll to the Violation Details section:
| Field | Value |
|---|---|
| Name | achan-sales@thezerotrustlab.com |
| Client IP | 54.255.194.66 |
| Department | Sales |
| Status | Validating with User |
The example's Current State Details panel shows Validating with User. Review User Notifications and State Changes below to establish what actions were recorded; the status alone does not identify whether they were manual or automated.
Step 2 — Review the Policy and Content Sections
Scroll down to the Policy and Content panels.
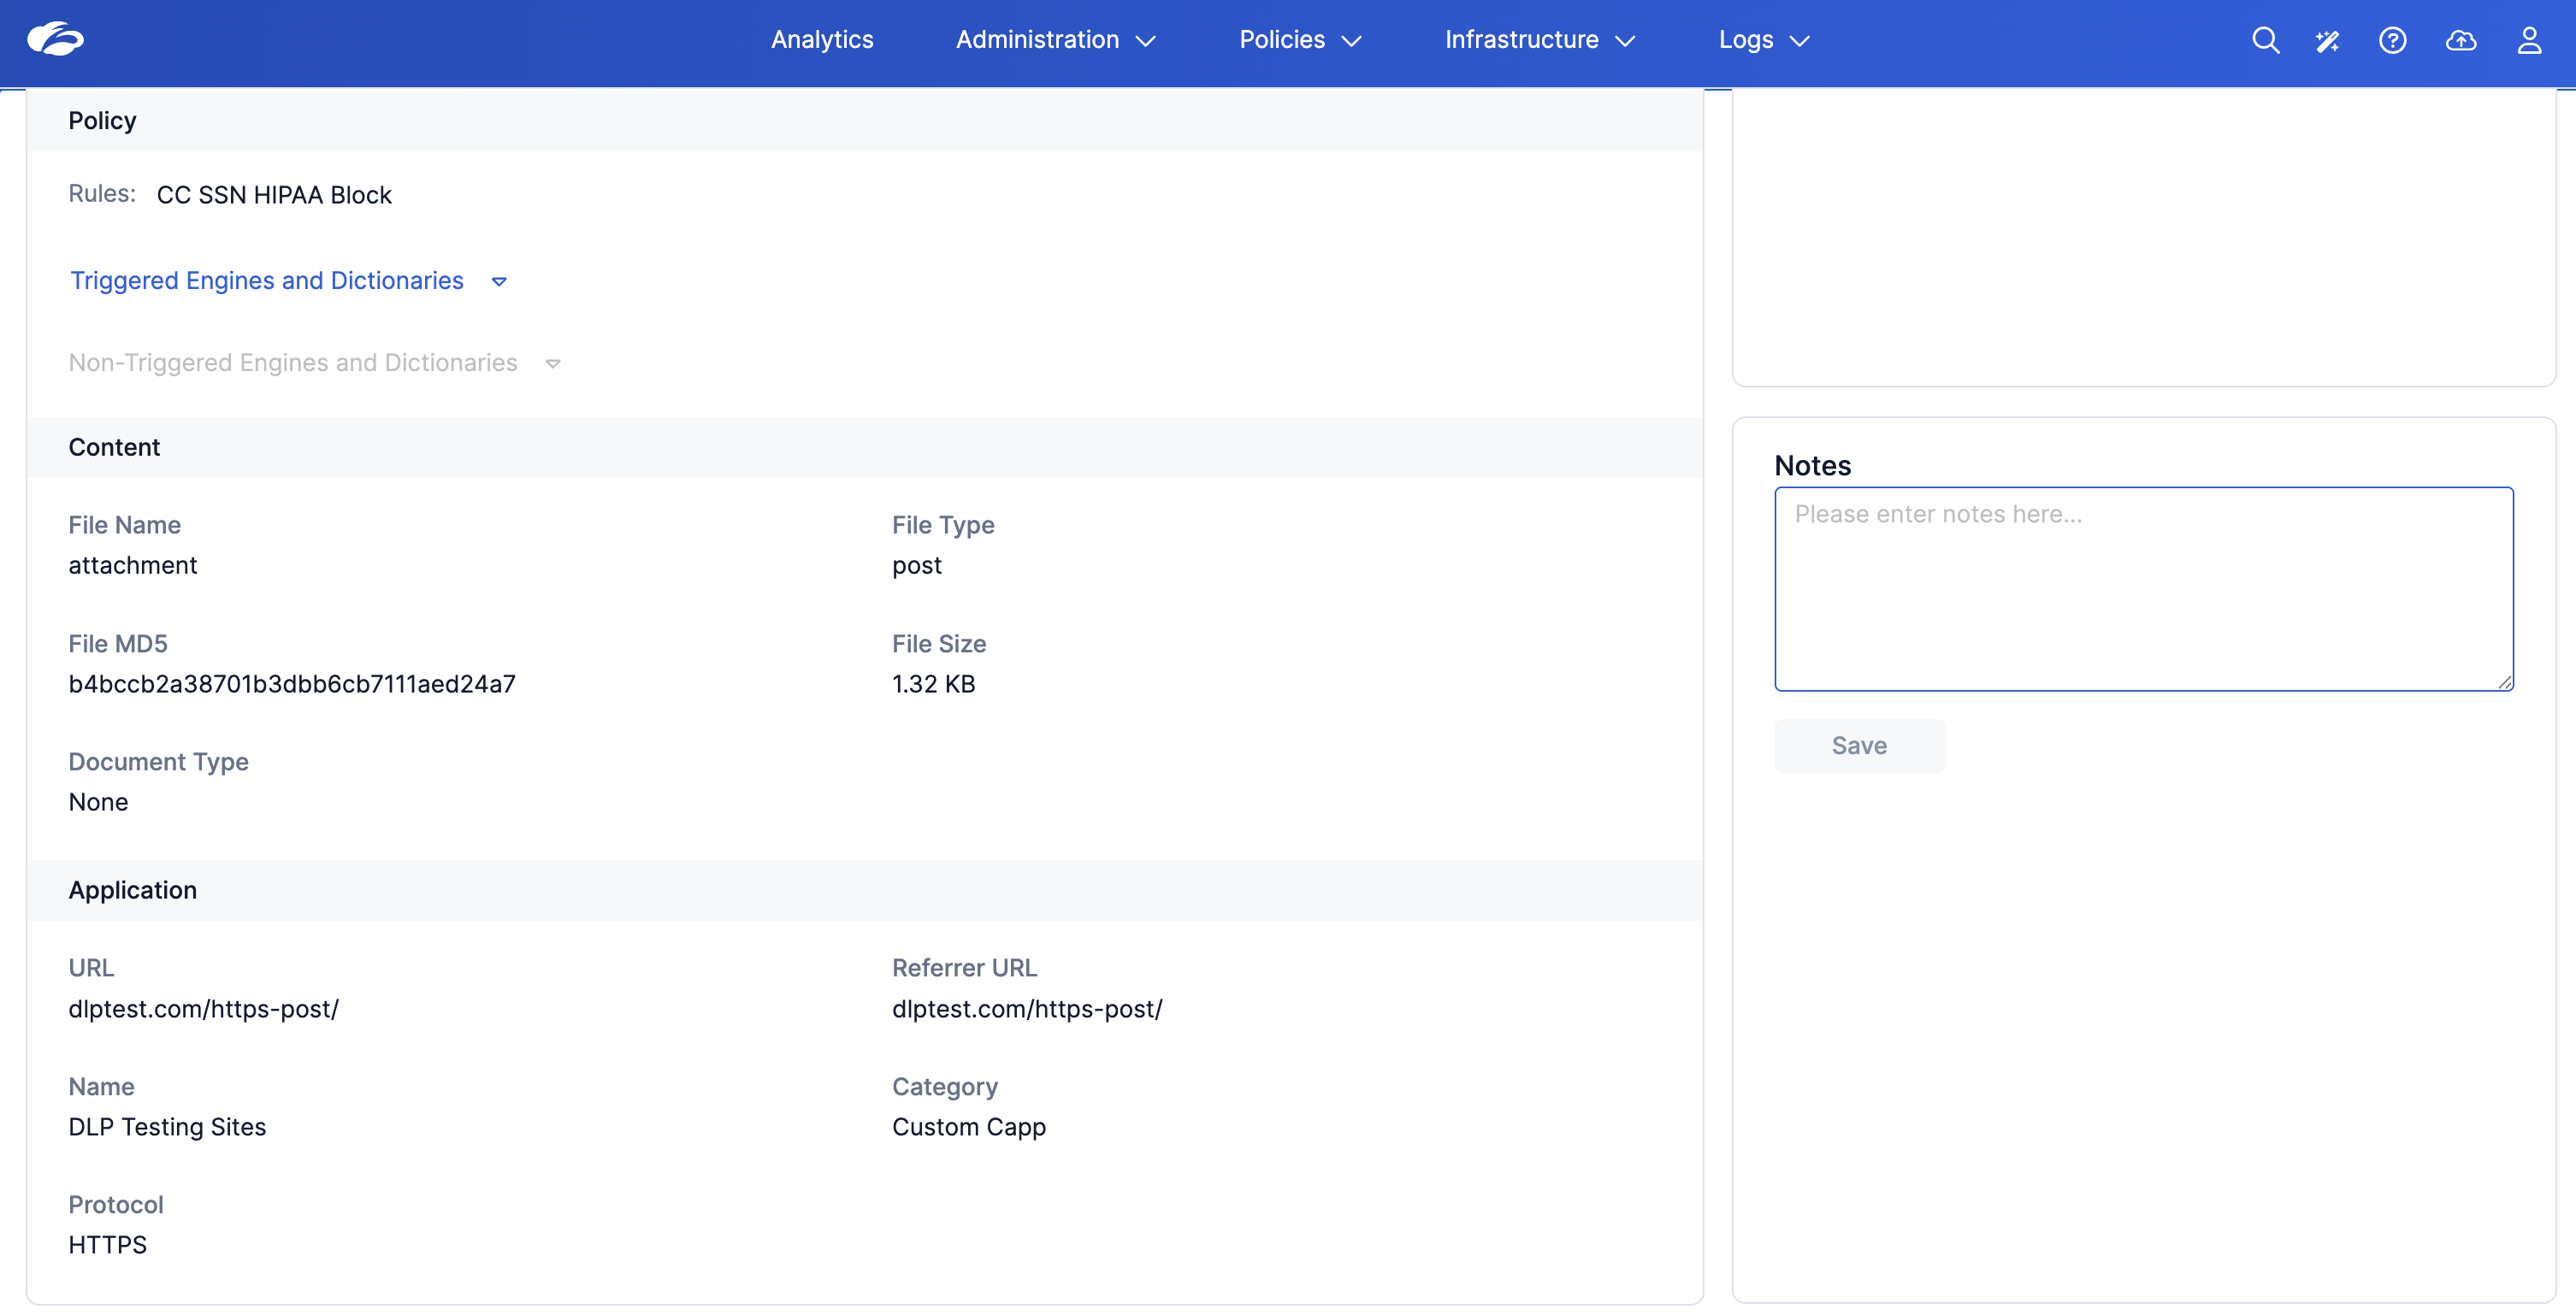
Policy section:
| Field | Value |
|---|---|
| Rules | CC SSN HIPAA Block |
| Triggered Engines | Expand to see which classification engines fired |
Content section:
| Field | Value |
|---|---|
| File Name | attachment |
| File Type | post |
| File MD5 | b4bccb2a38701b3dbb6cb7111aed24a7 |
| File Size | 1.32 KB |
| Document Type | None |
Application section:
| Field | Value |
|---|---|
| URL | dlptest.com/https-post/ |
| Referrer URL | dlptest.com/https-post/ |
| Name | DLP Testing Sites |
| Category | Custom Capp |
| Protocol | HTTPS |
The File MD5 hash is a pivotal forensic artefact. Priya can use this to verify whether the same file has appeared in multiple incidents, pivot into threat intelligence, or correlate with endpoint DLP logs.
Step 3 — Review Violation Content, User Notifications, and State Changes
Scroll further down to the Violation Content, User Notifications, and State Changes sections.
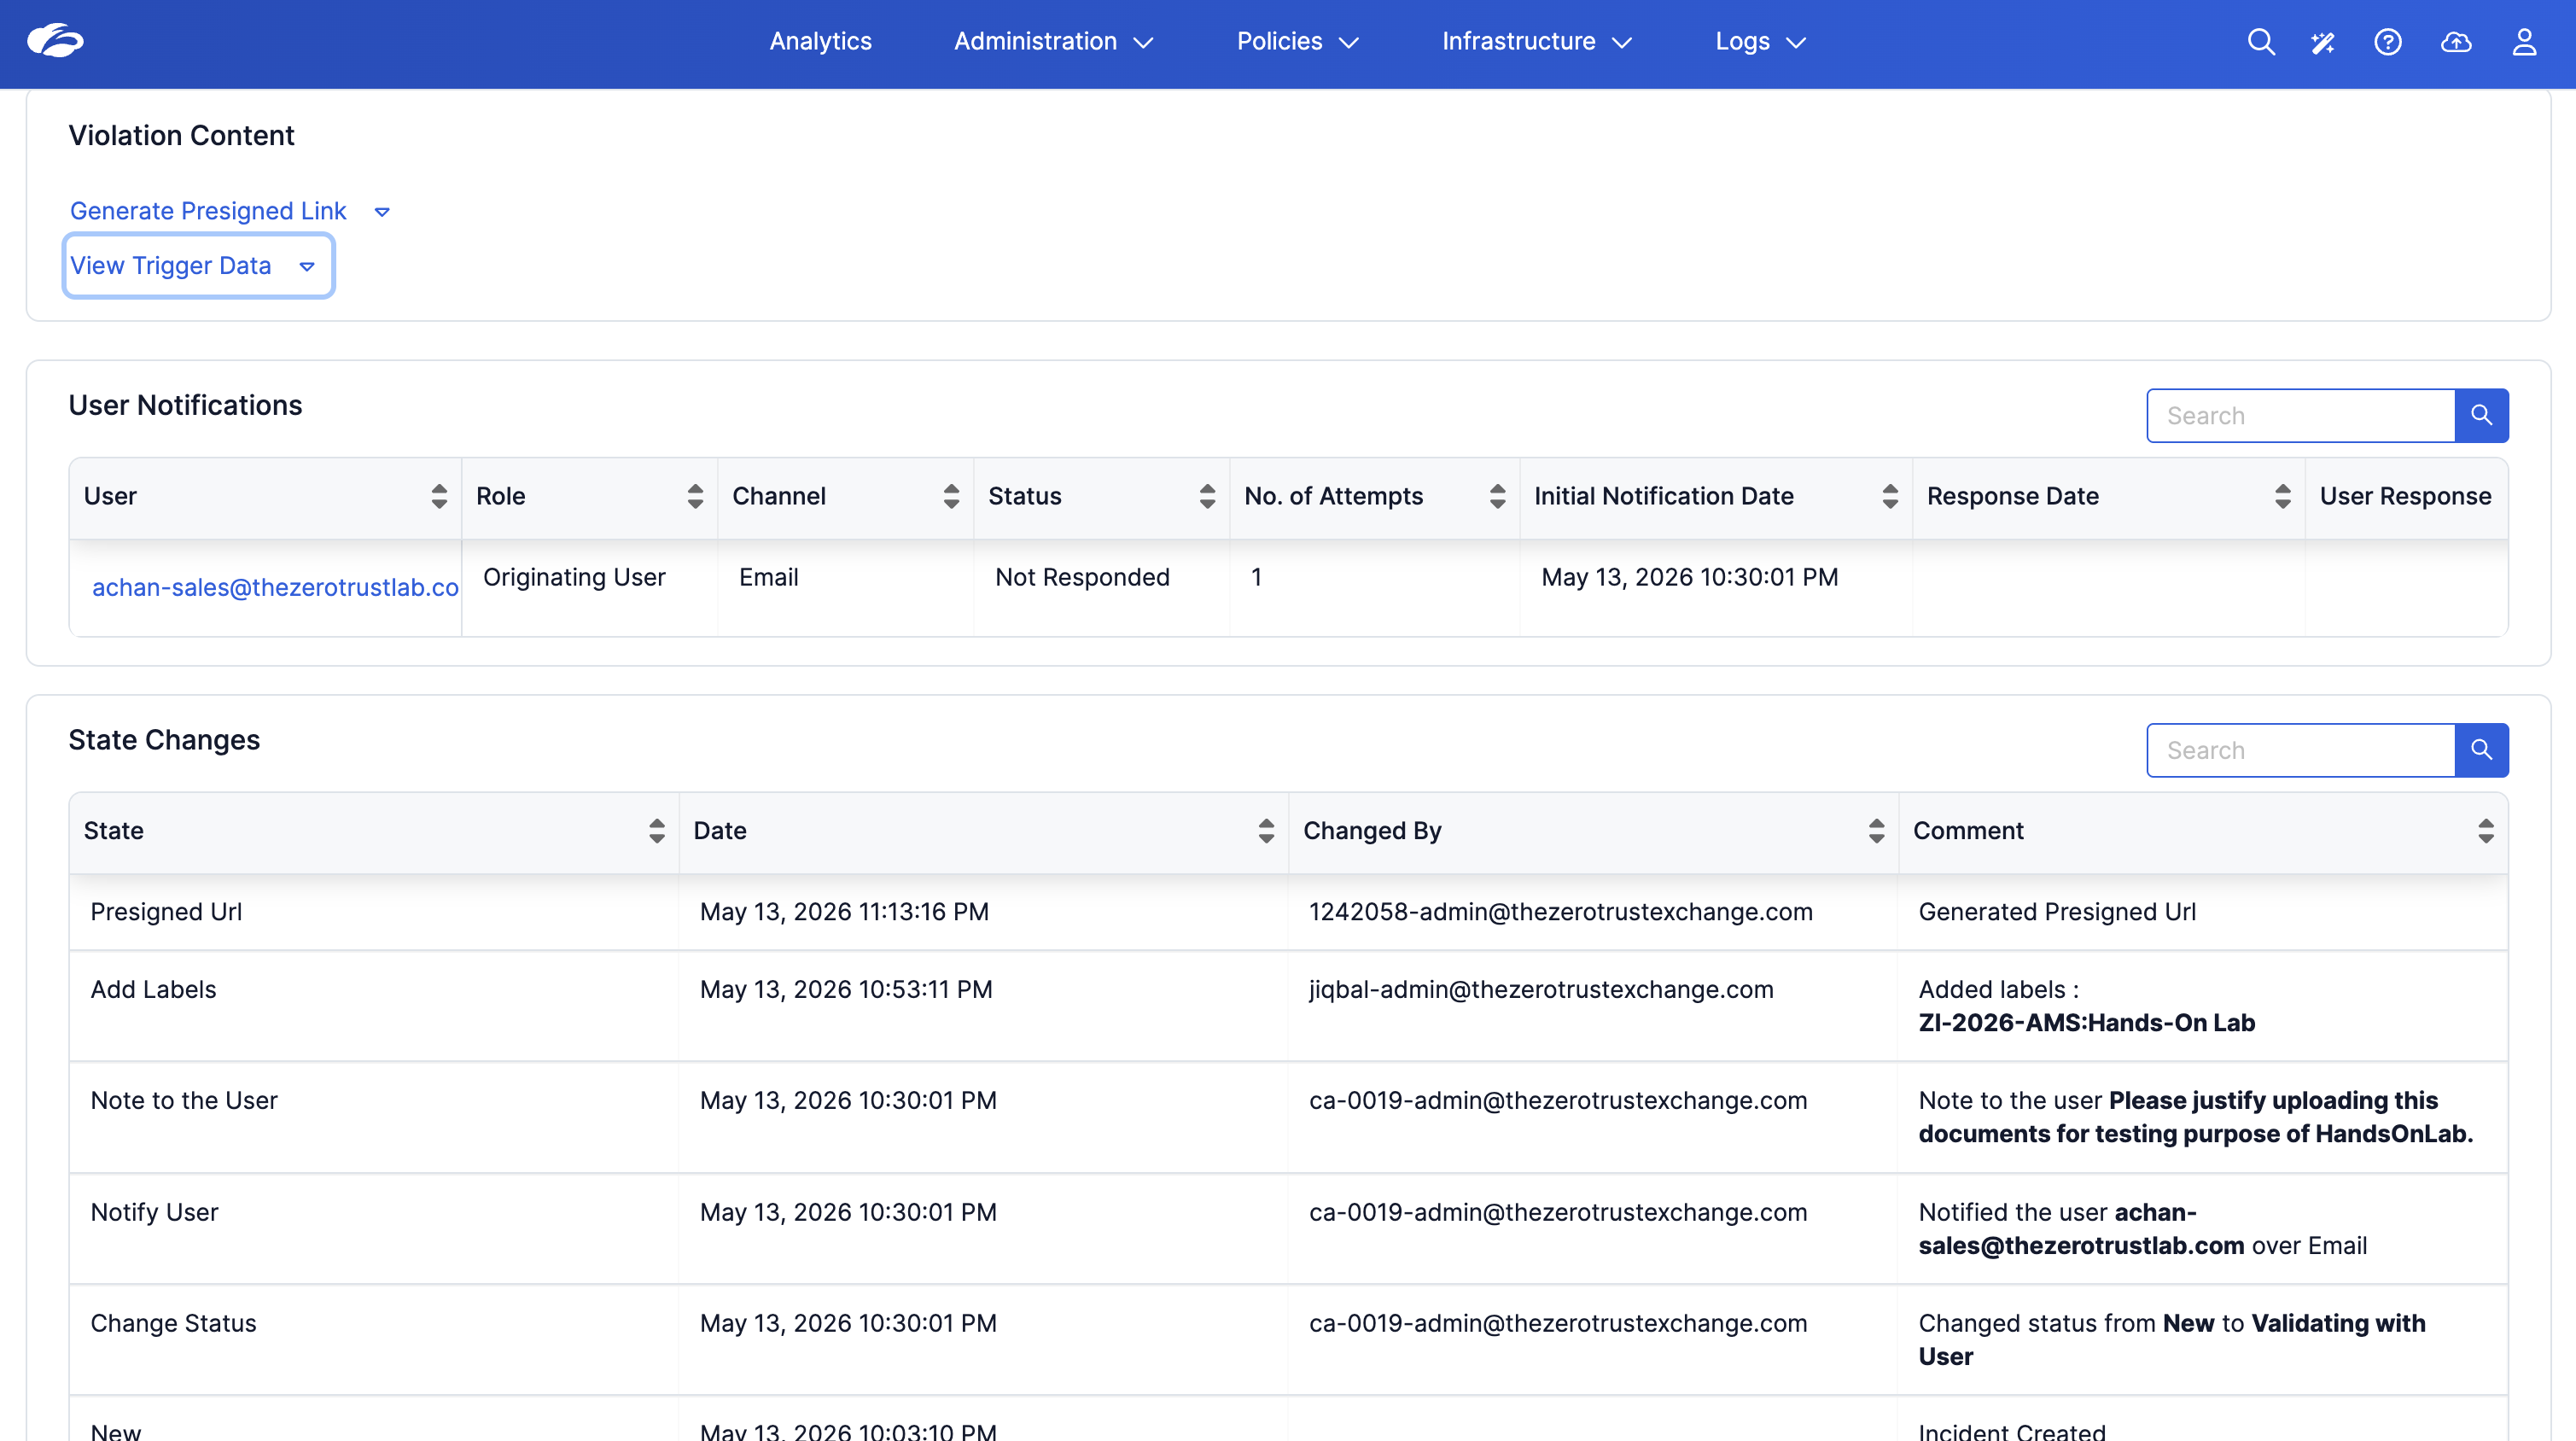
Violation Content:
- Generate Presigned Link — produces a time-limited URL to retrieve the actual violating file content (subject to tenant permissions).
- View Trigger Data — shows the raw data that fired the DLP engine, including matched content snippets and engine confidence scores.
User Notifications table:
| User | Role | Channel | Status | Attempts | Notified |
|---|---|---|---|---|---|
| achan-sales@thezerotrustlab.com | Originating User | Not Responded | 1 | May 13, 2026 10:30:01 PM |
State Changes audit trail (most recent first):
| State | Date | Changed By | Comment |
|---|---|---|---|
| Presigned Url | May 13 11:13 PM | 1242058-admin | Generated Presigned Url |
| Add Labels | May 13 10:53 PM | jiqbal-admin | Added label: ZI-2026-AMS:Hands-On Lab |
| Note to the User | May 13 10:30 PM | ca-0019-admin | Please justify uploading this document for testing purpose of HandsOnLab. |
| Notify User | May 13 10:30 PM | ca-0019-admin | Notified achan-sales over Email |
| Change Status | May 13 10:30 PM | ca-0019-admin | Changed status: New to Validating with User |
| New | May 13 10:03 PM | System | Incident Created |
Use State Changes to review the recorded actions, timestamps, actors, and comments. The example attributes notification and status changes to an administrator; identifying a specific automated workflow would require additional evidence.
Task 4 — Explore Available Actions
Return to the top of the Incident Details page and open Actions. Review the available options without executing them; this exercise explores existing records in the read-only Enterprise Tenant.
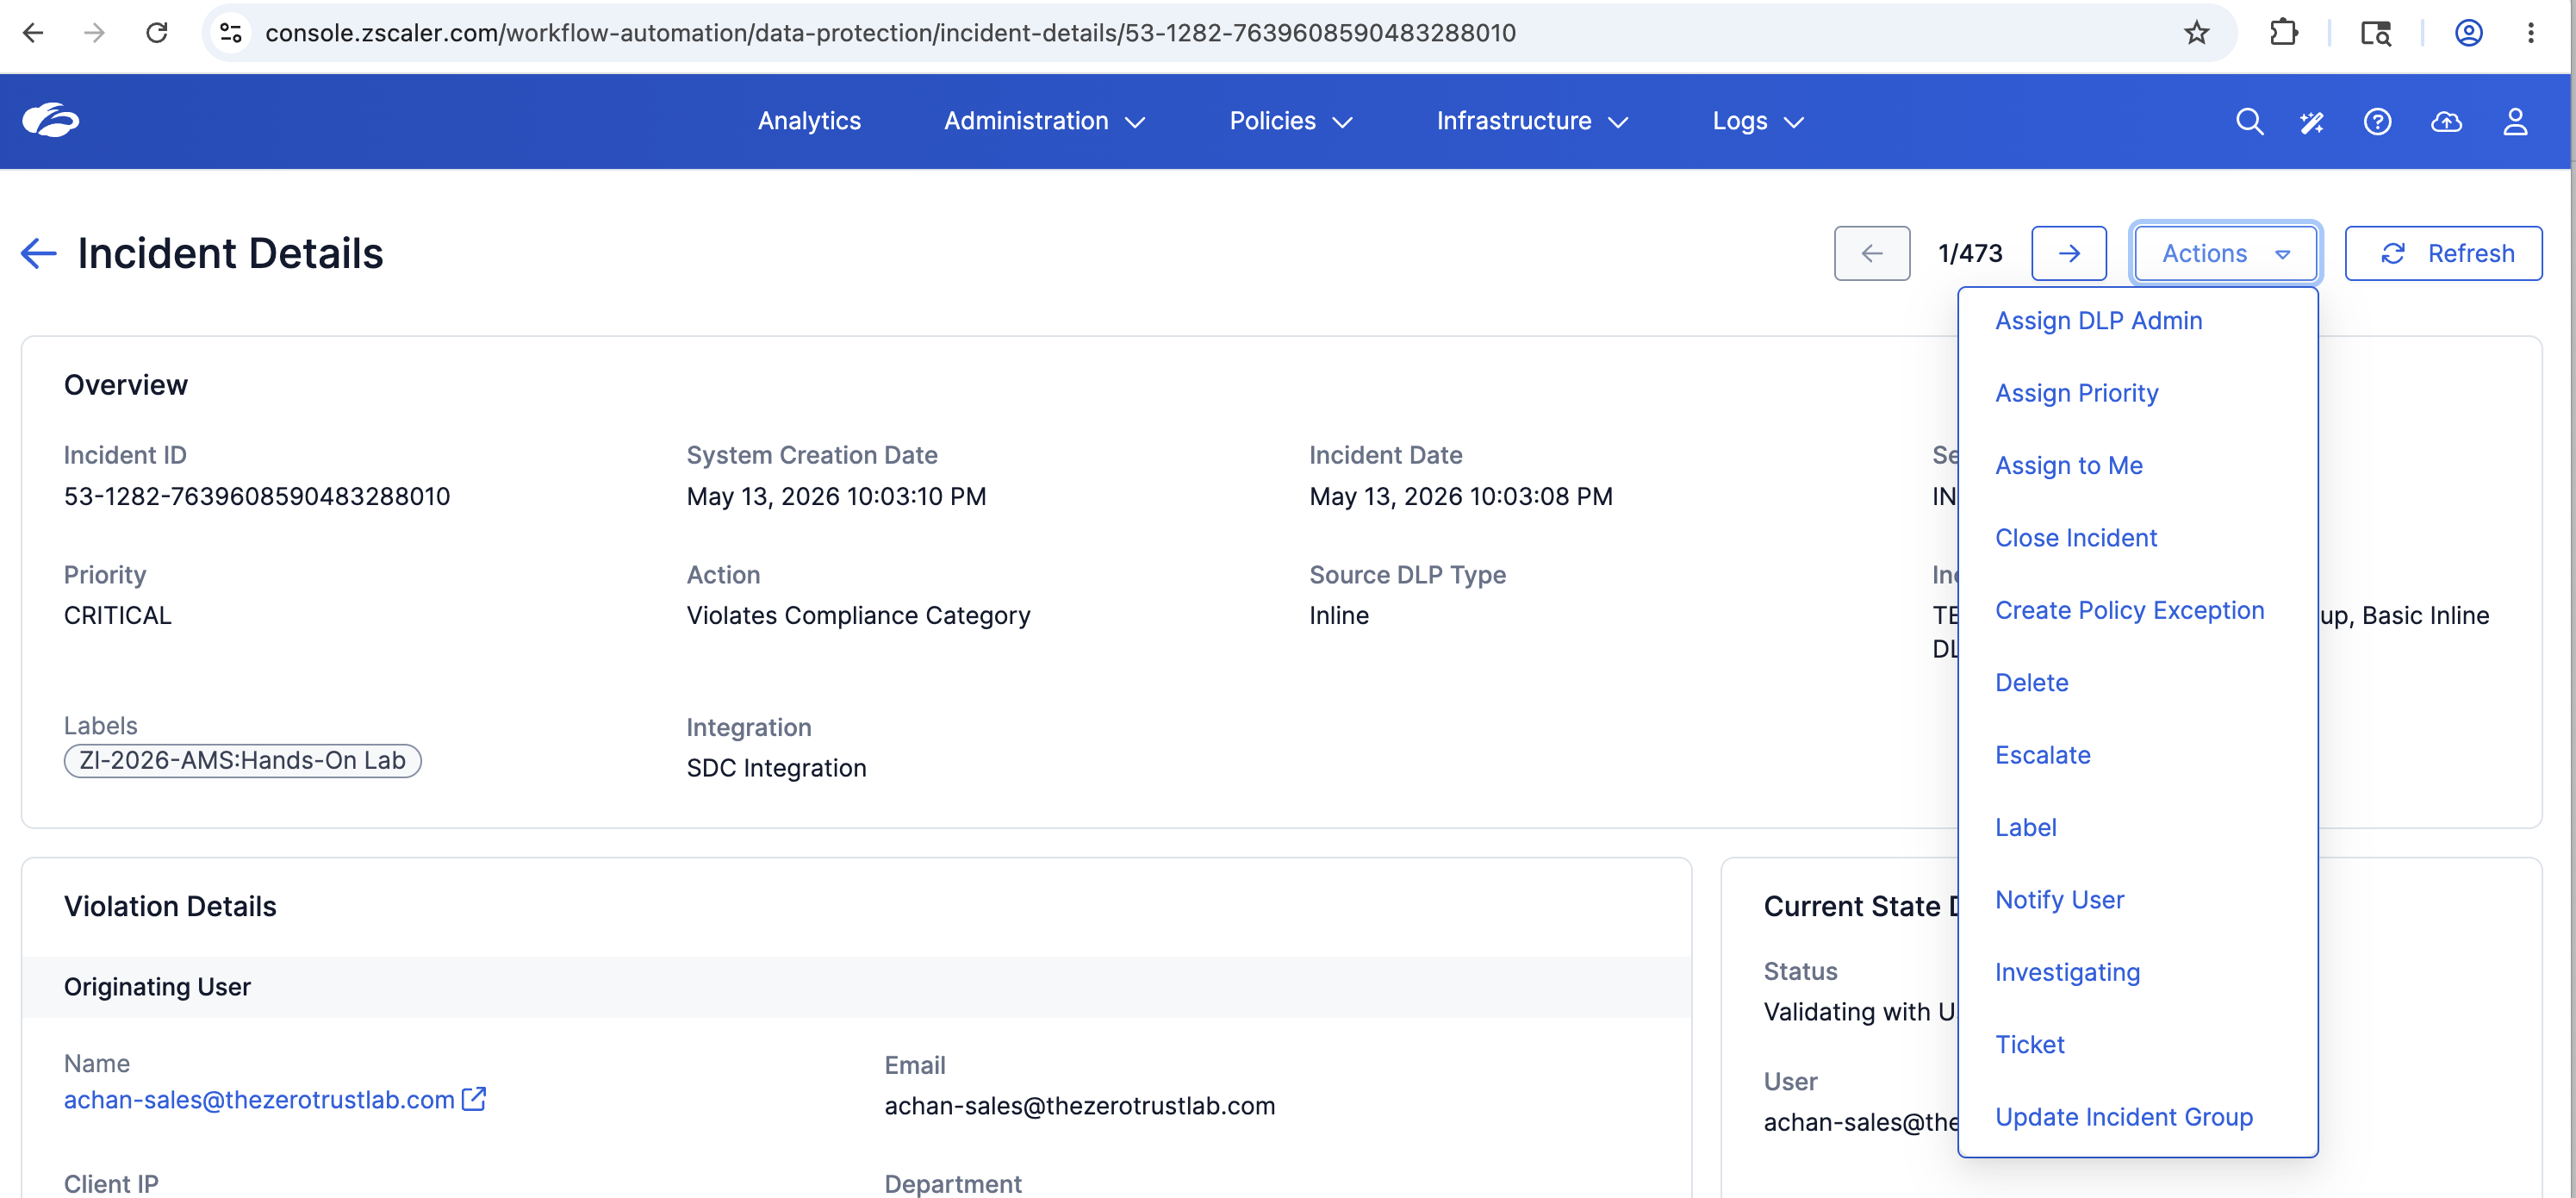
| Action | Description |
|---|---|
| Assign DLP Admin | Route incident to a named DLP administrator |
| Assign Priority | Manually override the system-calculated priority |
| Assign to Me | Claim the incident for personal investigation |
| Close Incident | Mark the incident as resolved and close it |
| Create Policy Exception | Allow the triggering pattern for this user or content type going forward |
| Delete | Remove the incident record (audited) |
| Escalate | Bump to senior analyst or management queue |
| Label | Tag the incident for reporting or grouping |
| Notify User | Send a manual notification/survey to the originating user |
| Investigating | Set status to indicate active analyst review |
| Ticket | Create a linked ticket in an integrated ITSM (e.g., ServiceNow) |
| Update Incident Group | Move incident to a different incident group |
Task 5 — Explore Workflow Templates
Priya has reviewed an incident and its recorded history. Next, preview an existing workflow template to understand how notification and escalation can be automated; no workflow configuration is required in this lab.
Steps
Step 1 — Navigate to Workflow Templates
In the left rail of Workflow Automation, expand Workflows and click Workflow Templates.
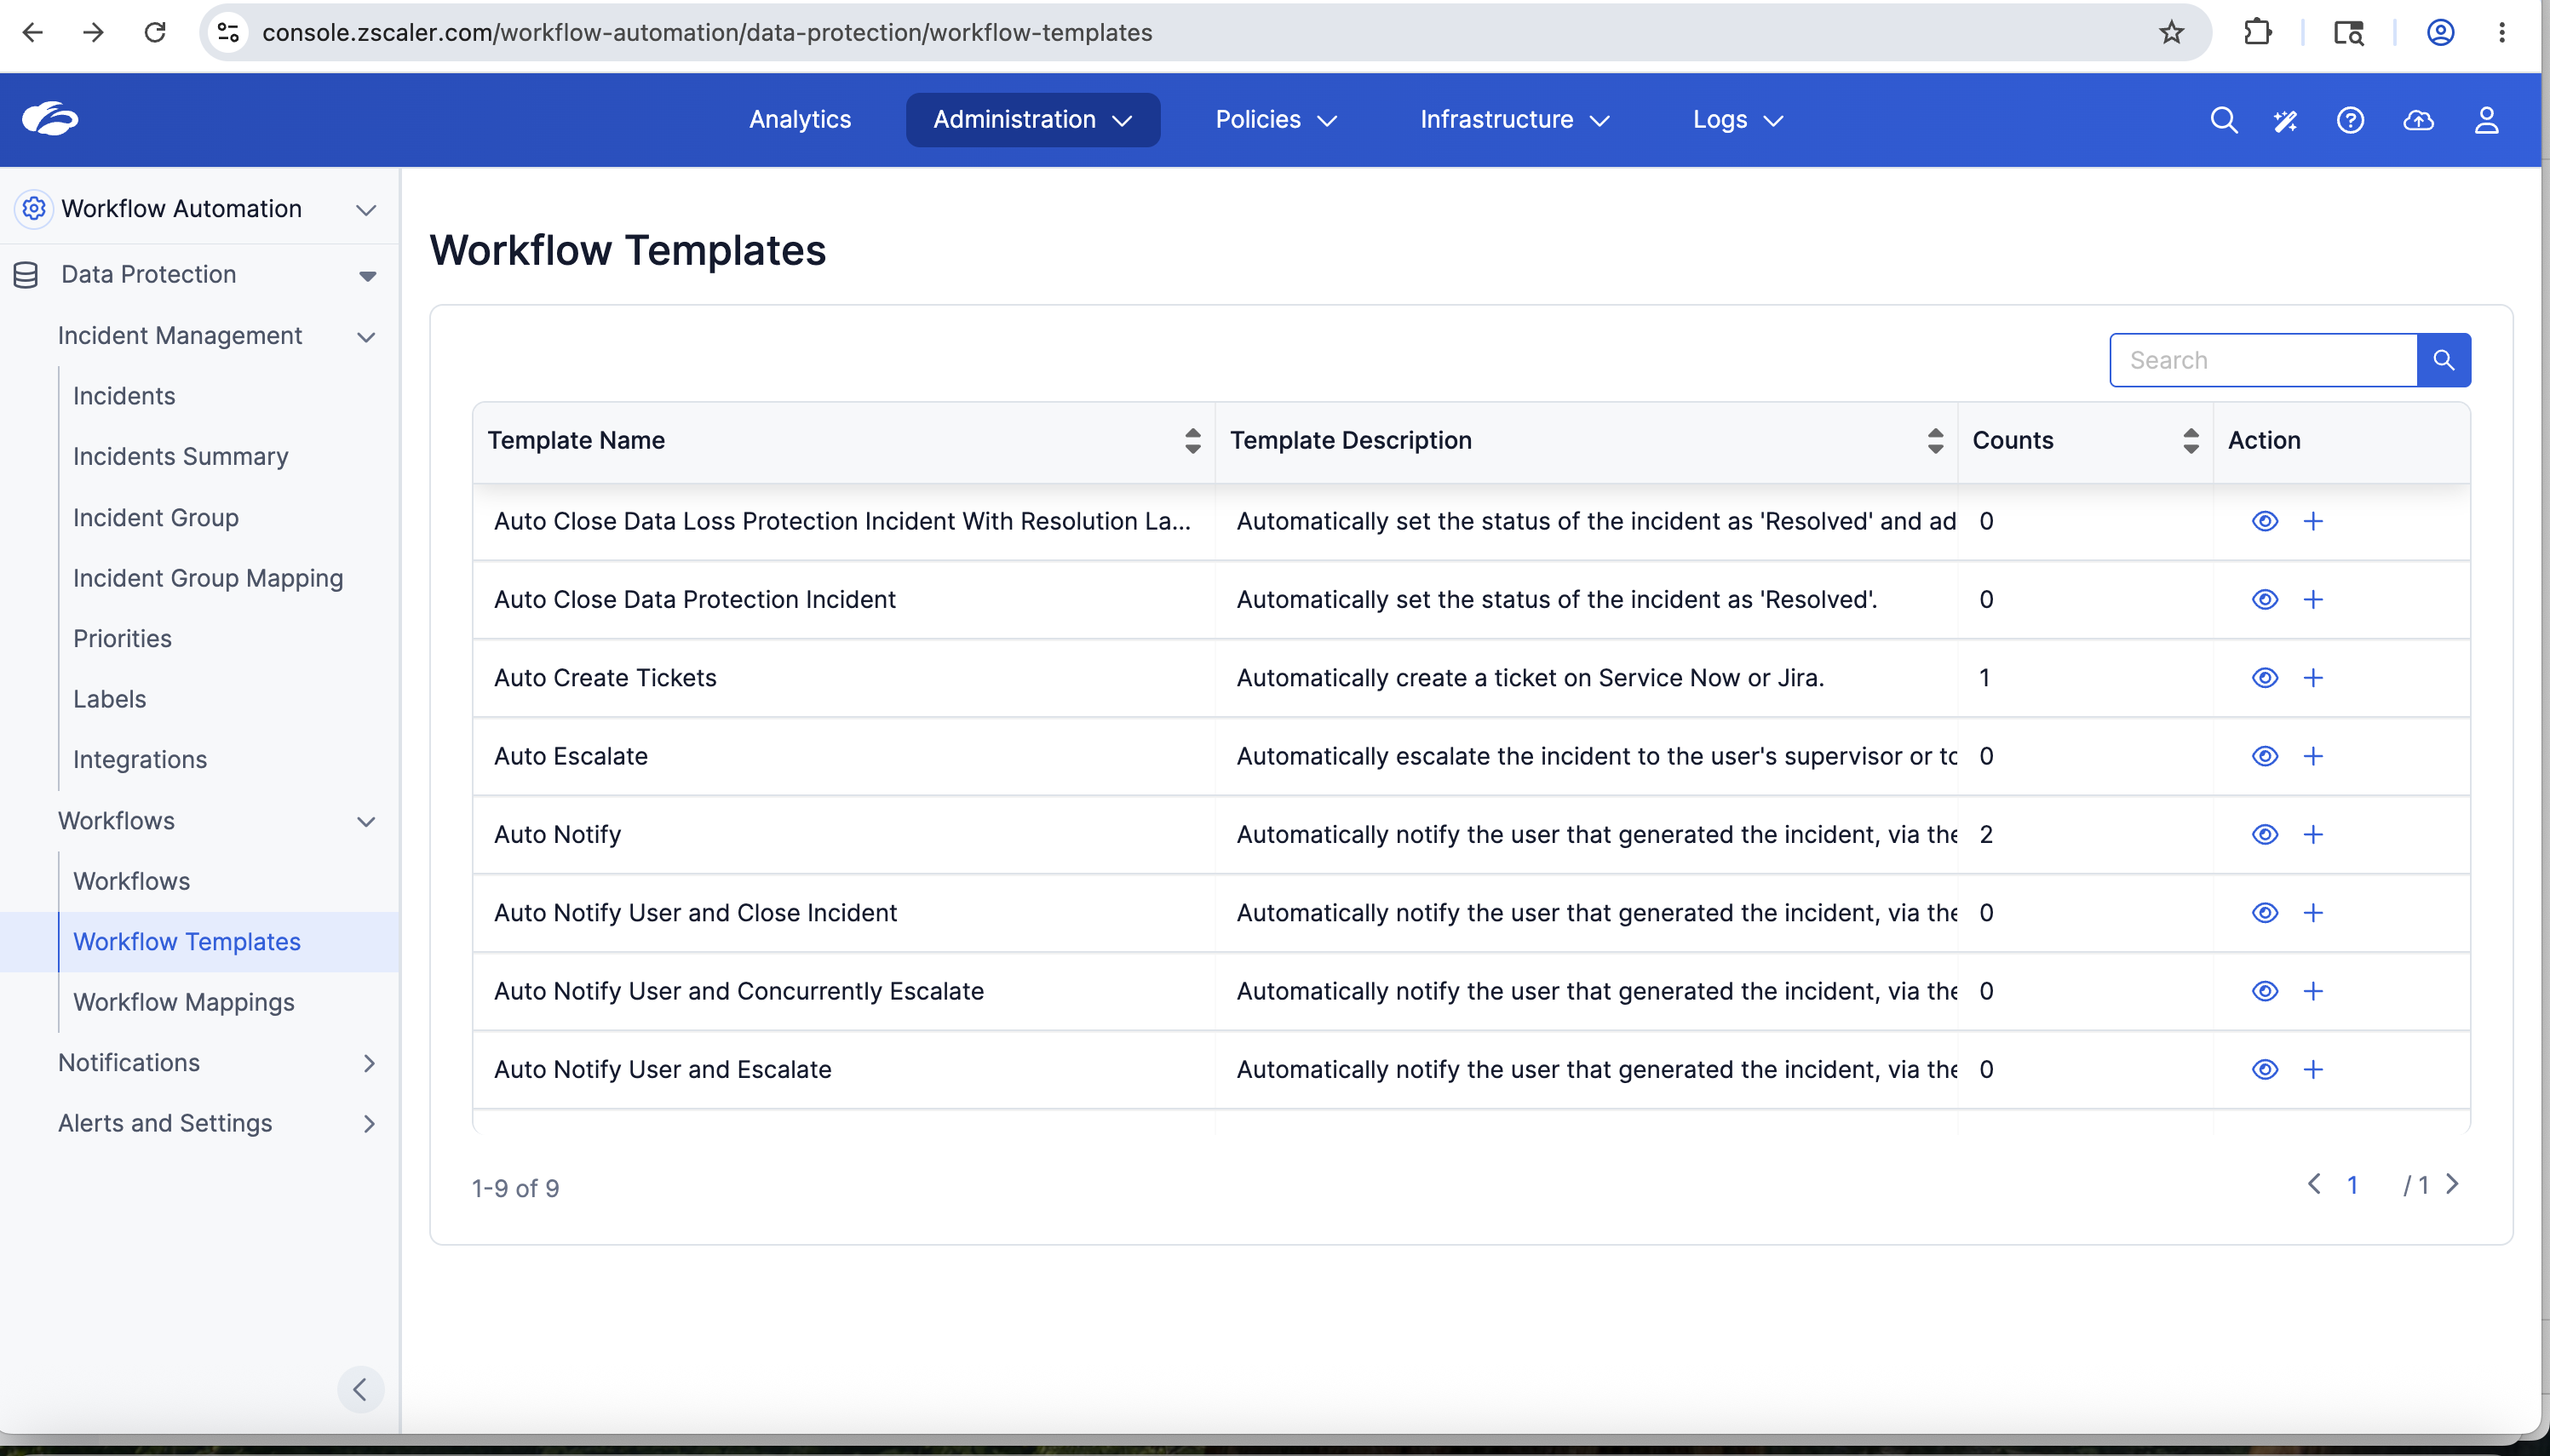
Review the available templates. Examples shown include:
| Template Name | Description |
|---|---|
| Auto Close Data Loss Protection Incident With Resolution La... | Automatically resolves the incident and adds a resolution label |
| Auto Close Data Protection Incident | Automatically sets status to Resolved |
| Auto Create Tickets | Automatically creates a ticket in ServiceNow or Jira |
| Auto Escalate | Automatically escalates to the user's supervisor or approver |
| Auto Notify | Automatically notifies the originating user via the configured channel |
| Auto Notify User and Close Incident | Notifies user then closes the incident in one step |
| Auto Notify User and Concurrently Escalate | Notifies user and escalates simultaneously |
| Auto Notify User and Escalate | Notifies user first, then escalates |
Review the Counts column and available mapping details. A count alone does not establish that a workflow ran for the incident you inspected; check its mapping criteria and execution evidence.
Step 2 — Preview the Auto Notify User and Concurrently Escalate Template
Click the eye icon next to Auto Notify User and Concurrently Escalate to open the workflow preview.
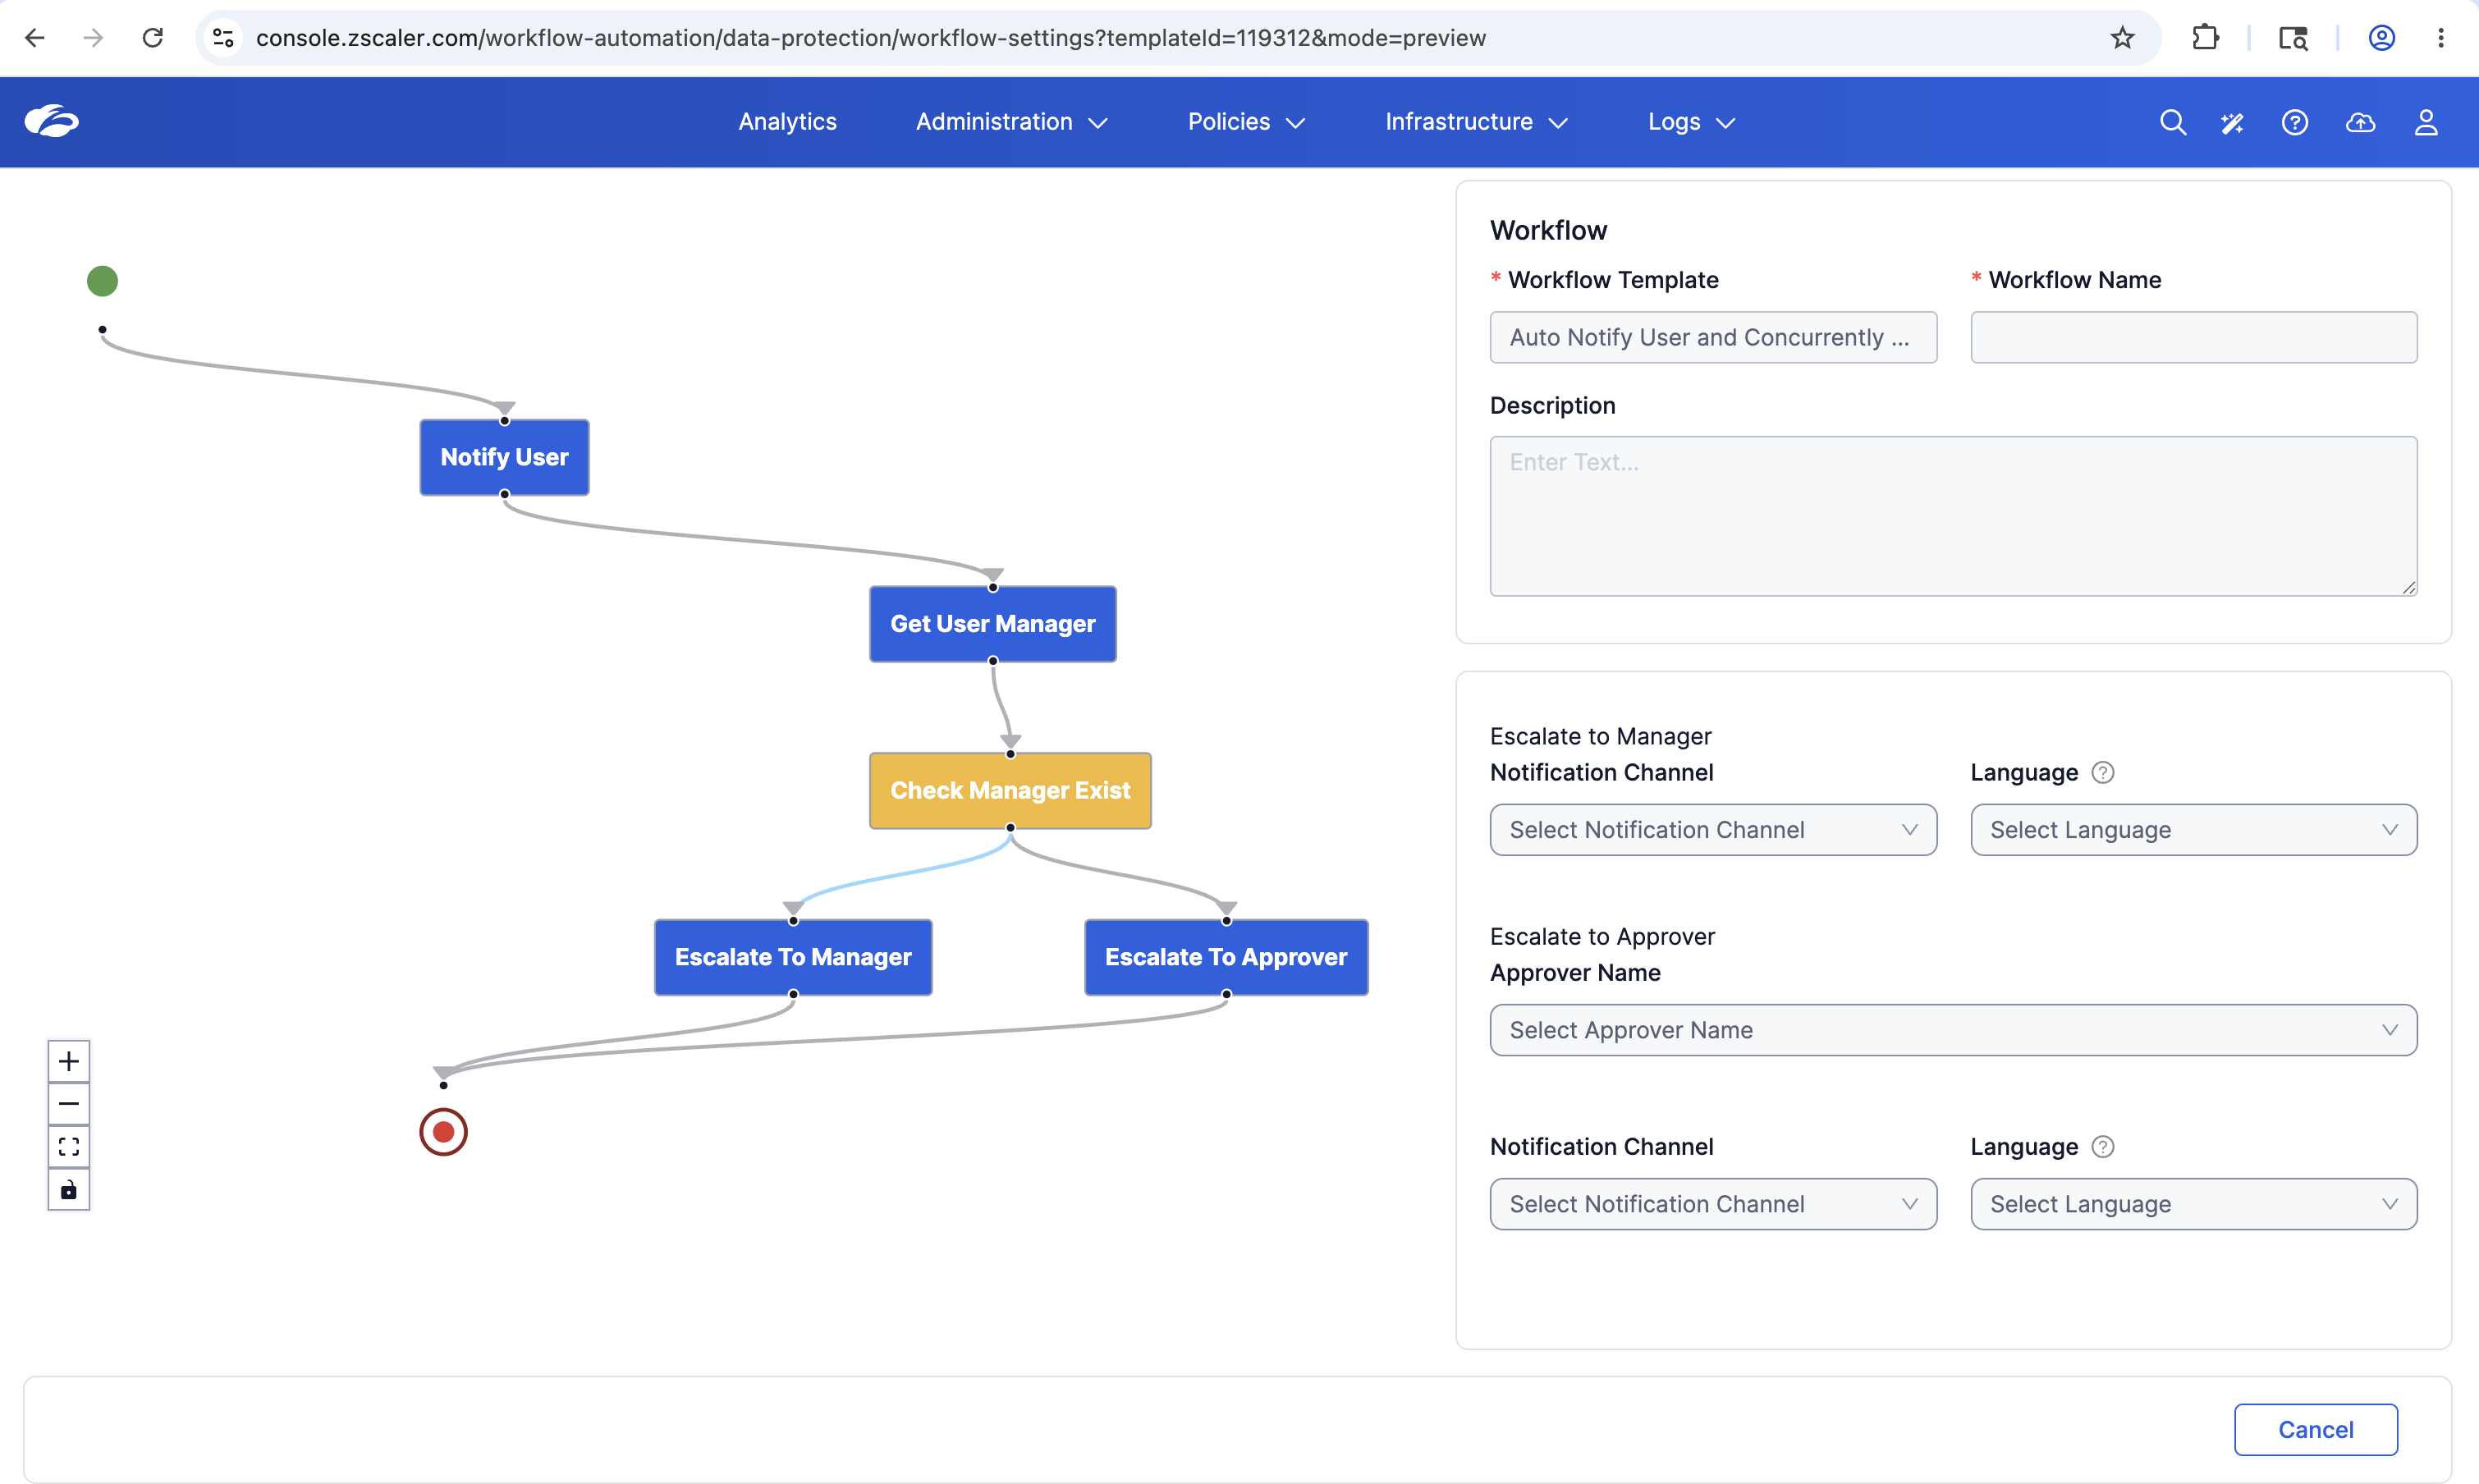
Read the visual workflow diagram:
| Node | Description |
|---|---|
| Start | Triggered when a matching incident is created |
| Notify User | Sends notification to the originating user |
| Get User Manager | Looks up the user's manager in the directory |
| Check Manager Exist | Decision node — does this user have a manager configured? |
| Escalate to Manager | If manager found — escalates to the user's direct manager |
| Escalate to Approver | If no manager — escalates to a pre-configured approver |
| End | Workflow completes |
The right panel shows the configurable settings:
- Escalate to Manager — Notification Channel + Language
- Escalate to Approver — Approver Name + Notification Channel + Language
This single template replaces what would otherwise be a multi-step manual process: notify, look up manager, escalate, confirm. It executes in seconds, automatically, for every incident that matches the workflow mapping criteria.
Lab Summary
In this lab, Priya explored a pre-populated incident and response workflow:
- Navigated to the Incidents queue via Administration → Workflow Automation
- Reviewed queue counts and statuses for the selected reporting window
- Filtered by Source DLP Type to compare Inline and Endpoint records
- Inspected an incident's user, file metadata, application, and policy details
- Reviewed recorded User Notifications and State Changes
- Explored available response actions without executing them
- Previewed an existing notification-and-escalation workflow template
Key Takeaway: Workflow Automation is not a passive log viewer. It is an active SOC workspace where detection, investigation, user notification, and automated response all converge — replacing the multi-tool, multi-console workflow most security teams operate today. The State Changes audit trail and Workflow Templates together deliver both compliance evidence and operational efficiency.
You have completed all 9 labs across three modules. Use these questions to connect the complementary Dataparity exercises while distinguishing observed evidence, student-built controls, and preconfigured examples.
Module 1 — Visibility
Q1. In Labs 1–4, Alex observed Dataparity's environment without enforcing any blocking policies. Why is it important to start with visibility before enforcement — and what risk does skipping this step create?
Q2. In Lab 3, how did Endpoint Data Scan, User Investigation's Data at Rest and Timeline views, Application Investigation, and connected-device Inventory contribute different parts of the endpoint picture? Use one example of a classification, incident, application, and device association. Why is the ZIA-calculated User Risk Profile not simply the sensitive-file count, and why does a device Allow record not prove that sensitive data was successfully exfiltrated?
Q3. Instance Discovery in Lab 1 distinguishes between corporate and personal instances of the same application (e.g., corporate Google Drive vs. personal Google Drive). Why does this matter for a DLP policy — and what would happen if you blocked the application rather than the personal instance?
Module 2 — Protection
Q4. Lab 5's DP Project Code engine combines Credit Cards AND ABA Bank Routing Number AND the custom DP Project Code dictionary, each with a condition greater than zero. Labs 6 and 7 reuse this engine; Lab 8 uses separate preconfigured browser policies. What benefit does detection reuse provide, and why do channel-specific policies and tests still matter?
Q5. Compare the six protection activities in Module 2. Complete the table with the control and outcome you observed; do not treat masking or watermarking as a block.
| Activity | Lab | Control / enforcement point | Observed outcome | Evidence or notification |
|---|---|---|---|---|
| Upload workforce financial summary to ChatGPT or a listed alternative | Lab 6 | |||
| Open the same document directly in Notepad++ | Lab 7 | |||
| Open in Word, copy content, and paste into Notepad++ | Lab 7 | |||
| Paste supplied customer text into a ChatGPT prompt | Lab 8 | |||
| Download the Name + SSN + CCN sample as PDF from dlptest.com/sample-data/ | Lab 8 | |||
| View the designated document in Chrome | Lab 8 |
Q6. Lab 6 reviews Web Insights, and Lab 7 reviews Endpoint DLP Insights. Lab 9 explores an independent pre-populated Workflow Automation queue with Inline and Endpoint filters. How does a combined incident view support triage, and what evidence would you need before linking a queue record to one of your own Lab Tenant tests?
Q7. Lab 8 tests Chrome with an authenticated Browser DLP extension. What deployment and policy checks would you make before claiming equivalent coverage in another browser? Which activities from Labs 6 and 7 could other layers address, and why should you not assume they reproduce browser masking or watermarking?
Q8. Lab 7's Clipboard rule was scoped to Notepad++ (Windows) as the destination application. A colleague suggests changing the destination to Any to maximize protection. What is the trade-off of setting destination to Any — and under what circumstances would you keep it scoped to a specific application?
Module 3 — Investigation
Q9. In Lab 9, the User Notifications table records an email to the originating user, and State Changes attributes Notify User and Change Status entries to a named admin. What do the channel, status, timestamp, and Changed By fields actually establish? What additional evidence would be needed to attribute the notification to a particular workflow, rather than inferring it from the incident status or the template you previewed?
Q10. Priya filtered the pre-populated queue by Source DLP Type = Inline + Endpoint. What would adding SaaS Security let her explore if matching records exist? Why would reviewing dashboards in the read-only Module 1 labs not itself generate those SaaS incidents?
Cross-Lab Synthesis
Q11. Dataparity and the three personas connect the workshop, but the labs do not trace one file across all three modules.
- How do Alex's visibility and policy work, Kevin's protection tests, and Priya's read-only investigation complement each other?
- Which document is actually reused in Labs 6 and 7, and how do Lab 8's customer text, sample PDF download, and watermarked document differ?
- Why should the independent records in Labs 3, 4, and 9 not be treated as the same file or the student's incident? Consider Lab 9's attachment/post, dlptest.com, and CC SSN HIPAA Block fields.
Q12. A customer asks: "If I deploy Inline Web DLP, Endpoint DLP, and Browser DLP, am I fully protected?" Based on Labs 6–8, what would you say? Consider SSL inspection, agent and extension deployment, rule scope, untested channels, and the difference between a preventive block and a deterrent watermark.
What You Practised Today
The three modules demonstrate parts of a data security program: observe risk, configure and test controls, and investigate evidence. They do not build or validate a complete production deployment.
The central insight: Sensitive data can be exposed through different activities. Network inspection, endpoint controls, and browser controls provide complementary protection; deployment coverage, policy scope, and evidence still need validation.
The Dataparity Story — Complementary Exercises
| Module | What You Did | Allocation |
|---|---|---|
| Module 1 — Visibility | Reviewed SaaS usage, posture and OAuth access; explored endpoint sensitive data, user timelines, applications and connected-device inventory; assessed Copilot sharing exposure | 60 min: Labs 1–4, 20 / 15 / 15 / 10 min |
| Module 2 — Protection | Built detection logic and web/endpoint policies in Labs 5–7; tested preconfigured browser controls in Lab 8 | 90 min: Labs 5–8, 15 / 25 / 25 / 25 min |
| Module 3 — Investigation | Reviewed a pre-populated queue, incident evidence, existing notifications and state changes, available actions, and a workflow preview | 30 min: Lab 9, 20 min + knowledge check, 10 min |
Allow 15 minutes for the Module 2 prerequisites, including CloudShare access, Client Connector setup, and SSL/TLS inspection verification for the lab HTTPS traffic. Setup is included in the overall workshop estimate.
The company and personas connect the labs, not one continuous file journey. Dataparity_Q2_2025_Workforce_Financial_Summary.docx is reused in Labs 6 and 7. Lab 8 uses supplied customer text, a sensitive sample PDF from DLP Test, and a browser-viewed document. Labs 3, 4, and 9 explore independent pre-populated records; they do not trace the student's document through all three modules.
The Three Protection Layers You Tested
Kevin attempted to upload the workforce financial summary to ChatGPT or a listed alternative. With SSL inspection applicable to the lab HTTPS traffic, Inline Web DLP inspected the upload and blocked it using the DP Project Code engine. Alex reviewed the custom End User Notification and the event in Web Insights.
Two distinct local activities were blocked. Application File Access prevented Notepad++ from opening the document. Kevin then opened it in Word, copied the content, and attempted to paste into Notepad++; the Clipboard rule blocked that paste. Alex compared File Read and Paste Text events in Endpoint DLP Insights. These tests did not require a web upload.
Using Chrome with the authenticated Browser DLP extension, Kevin tested three preconfigured controls: masking sensitive values in a ChatGPT prompt, blocking the Name + SSN + CCN PDF download from DLP Test with a Download Blocked message, and displaying a viewer-identity watermark on a browser-viewed document. These are distinct outcomes: masking, download prevention, and a visual deterrent.
Detection Reuse — What the Labs Demonstrate
Lab 5 creates a custom dictionary and an engine named DP Project Code. The engine uses ALL, with each component matching more than zero times:
(Credit Cards > 0)
AND (ABA Bank Routing Number > 0)
AND (DP Project Code > 0)
            |
            +-- Lab 6: Inline Web DLP
            +-- Lab 7: Endpoint DLP — Application File Access and Clipboard

Lab 8: Separate preconfigured Browser DLP policies
SSN is not a separate component of this engine. Lab 5 also selects SaaS Security and Outbound Email DLP as engine channels, but the workshop does not configure or test enforcement policies for those channels. It does not establish that this student-built engine powers Browser DLP or every data protection surface.
Investigation — Evidence, Not Assumed Continuity
For Module 3, return to the Enterprise Tenant using CloudShare → Credentials → SDC Credentials, not the Module 2 Student Admin login. Lab 9's example is an existing Inline incident: attachment, type post, at dlptest.com/https-post/, with rule CC SSN HIPAA Block. It is not a verified continuation of Kevin's student-tenant tests.
Priya reviewed the existing User Notifications table and attributed State Changes, explored the Actions menu without executing actions, and previewed Auto Notify User and Concurrently Escalate without configuring it. A notification record does not by itself prove which workflow produced it.
Key Takeaways
1. Visibility provides context. SaaS posture, sharing exposure, endpoint data, user activity, applications, and device inventory help identify questions to investigate before tuning enforcement. In Lab 3, User Risk Profile is calculated in ZIA, not from the displayed sensitive-file count. A device Allow record does not prove successful sensitive-data exfiltration, and a recorded device association does not mean it is connected now.
2. Protection outcomes differ. The exercises cover an upload block, a file-read block, a clipboard-paste block, browser masking, sensitive-download blocking, and watermarking. Validate the outcome and evidence for each activity rather than treating all controls as identical.
3. Shared detection still needs scoped policies. Labs 6 and 7 reuse Lab 5's engine, while their rules select different activities and applications. Lab 8 is a separate preconfigured experience. Other browsers, devices, destinations, and data types require their own coverage validation; three layers do not guarantee complete protection.
4. Investigation closes the learning loop. Read-only investigation shows how evidence, notification history, and workflow previews inform response decisions. You did not send notifications, escalate incidents, or configure automation in Module 3.
5. User guidance matters. The custom block message in Lab 6 and the existing notification history in Lab 9 illustrate how clear explanations and follow-up can support safer behaviour. They are separate exercises, not proof that one user's actions produced every record.
Learn More
Ready to go deeper? Explore Zscaler's data security platform:
Whitepapers, solution briefs, and architecture guides for data security use cases covered today — and beyond.
Share Your Feedback
We'd love to hear about your experience today. Takes less than 2 minutes.
Your feedback directly shapes the next iteration of this lab. 6 questions, 2 minutes.