Lab 9 – SOC Triage with Workflow Automation
Triage DLP incidents in Workflow Automation — from queue navigation to incident drill-down to automated response templates.
Background
Throughout this lab guide, Kevin has triggered DLP violations across multiple channels — inline web, endpoint, and browser. Every one of those policy hits lands in a single place: Workflow Automation (WFA). This is Dataparity's nerve centre for incident triage.
As Priya, Dataparity's SOC Analyst, your job is to investigate what happened with the payroll upload incident. You'll navigate the unified incident queue, filter by channel, drill into the specific incident, and understand exactly what Zscaler captured — from the file hash to the state-change audit trail — so you can make an informed response decision.
This lab uses the Enterprise Tenant (Read-Only). Priya can explore every panel and drop-down, but cannot save changes. Draw attention to the breadth of triage information available without ever leaving the WFA console. If time is tight, Task 1 and Task 3 are the must-sees; Task 2 can be pointed out during the Task 1 walkthrough.
Task 1 — Navigate to Workflow Automation and Open the Incidents Queue
Workflow Automation is accessed from the main Zscaler console navigation bar. Follow the steps below to reach the Incidents list.
Steps
Step 1 — Open Administration → Workflow Automation
From the top navigation bar, click Administration. In the drop-down, locate the Workflow Automation section on the far right and click it to switch context.
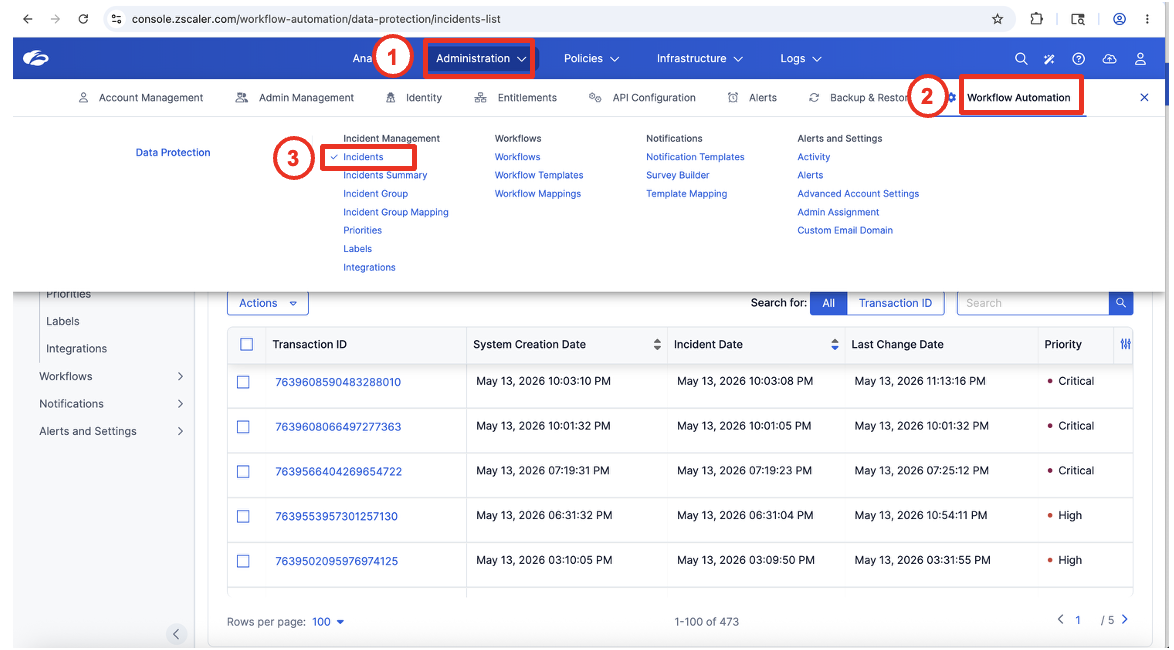
Callout 1 — Click Administration in the top nav. Callout 2 — Select Workflow Automation from the sub-menu. Callout 3 — Under Incident Management, click Incidents.
Point out the full left-rail structure: Incident Management (Incidents, Summary, Groups, Priorities, Labels, Integrations), Workflows, Notifications, and Alerts and Settings. This is the complete SOC workflow surface — not just a log viewer.
Step 2 — Review the Incidents Landing Page
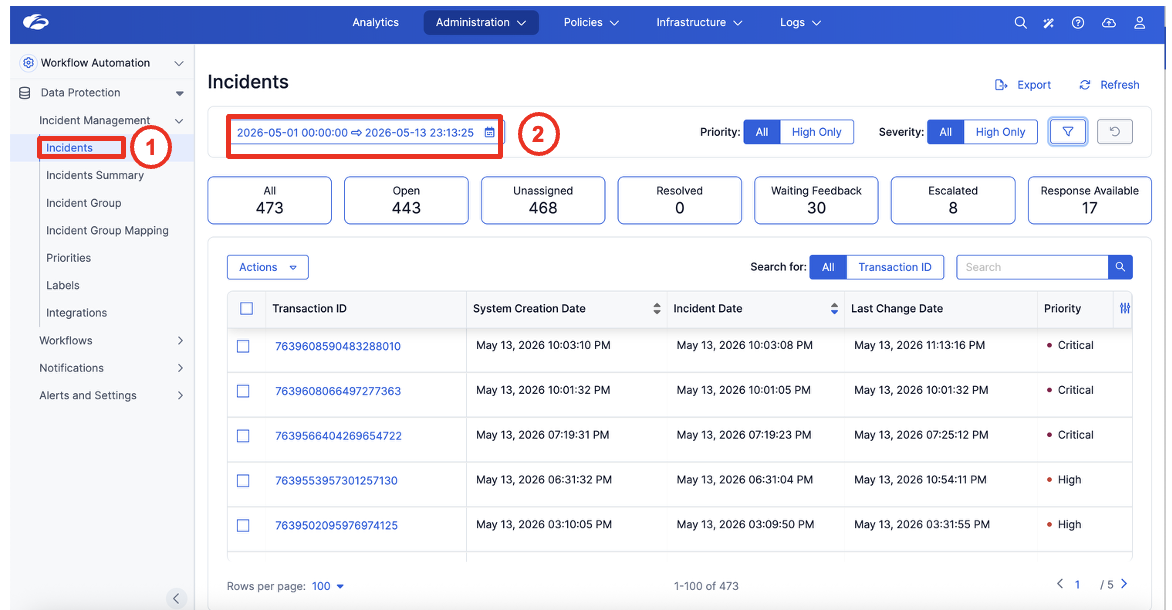
You are now on the Incidents list. This is your single pane of glass — every DLP policy violation across every channel flows into this queue.
Observe the following on this page:
| Element | What it shows |
|---|---|
| Date Range | Incidents from 2026-05-01 through today |
| All: 473 | Total incidents in the selected window |
| Open: 443 | Incidents not yet resolved |
| Unassigned: 468 | Incidents with no assigned analyst |
| Waiting Feedback: 30 | Incidents pending user justification |
| Escalated: 8 | Incidents flagged for senior review |
| Response Available: 17 | Incidents where an automated response is ready |
The Priority and Severity quick filters at the top right let you surface Critical and High incidents instantly without opening the advanced filter panel.
Task 2 — Filter by Source DLP Type
Zscaler consolidates incidents from all DLP channels in the same queue. Use the Filters panel to isolate the channels relevant to your investigation.
Steps
Step 1 — Open the Filters Panel
Click the filter icon (funnel) at the top right of the Incidents toolbar.
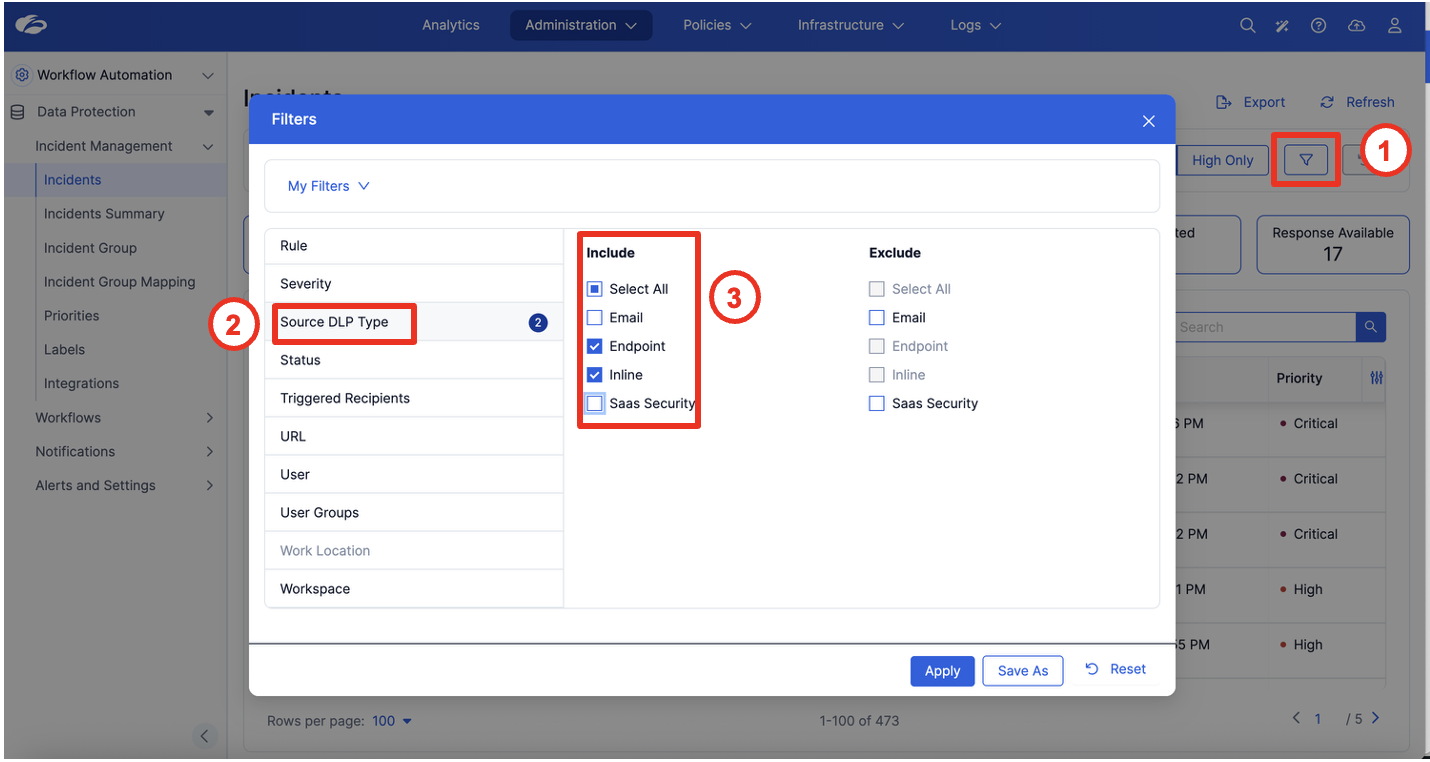
Callout 1 — Click the filter funnel icon. Callout 2 — Select Source DLP Type from the filter category list. Callout 3 — Check Endpoint and Inline under Include to see violations from those two channels side by side.
Available Source DLP Types:
- Email — incidents from ZIA Email DLP
- Endpoint — incidents from Zscaler Client Connector endpoint DLP agent
- Inline — incidents from ZIA inline proxy (web traffic)
- SaaS Security — incidents from SSPM / cloud app scanning
This is the key single-pane-of-glass moment. Emphasise that a Netskope or Purview customer would be jumping between 2–3 separate consoles to see what Priya sees here in one filtered view. The filter can be saved as a named preset under Save As for recurring triage workflows.
Task 3 — Drill Into an Incident: Full Triage Walk-Through
Now open one of the inline incidents to see the complete forensic picture Zscaler captures.
Steps
Step 1 — Open the Incident Details Page (Overview)
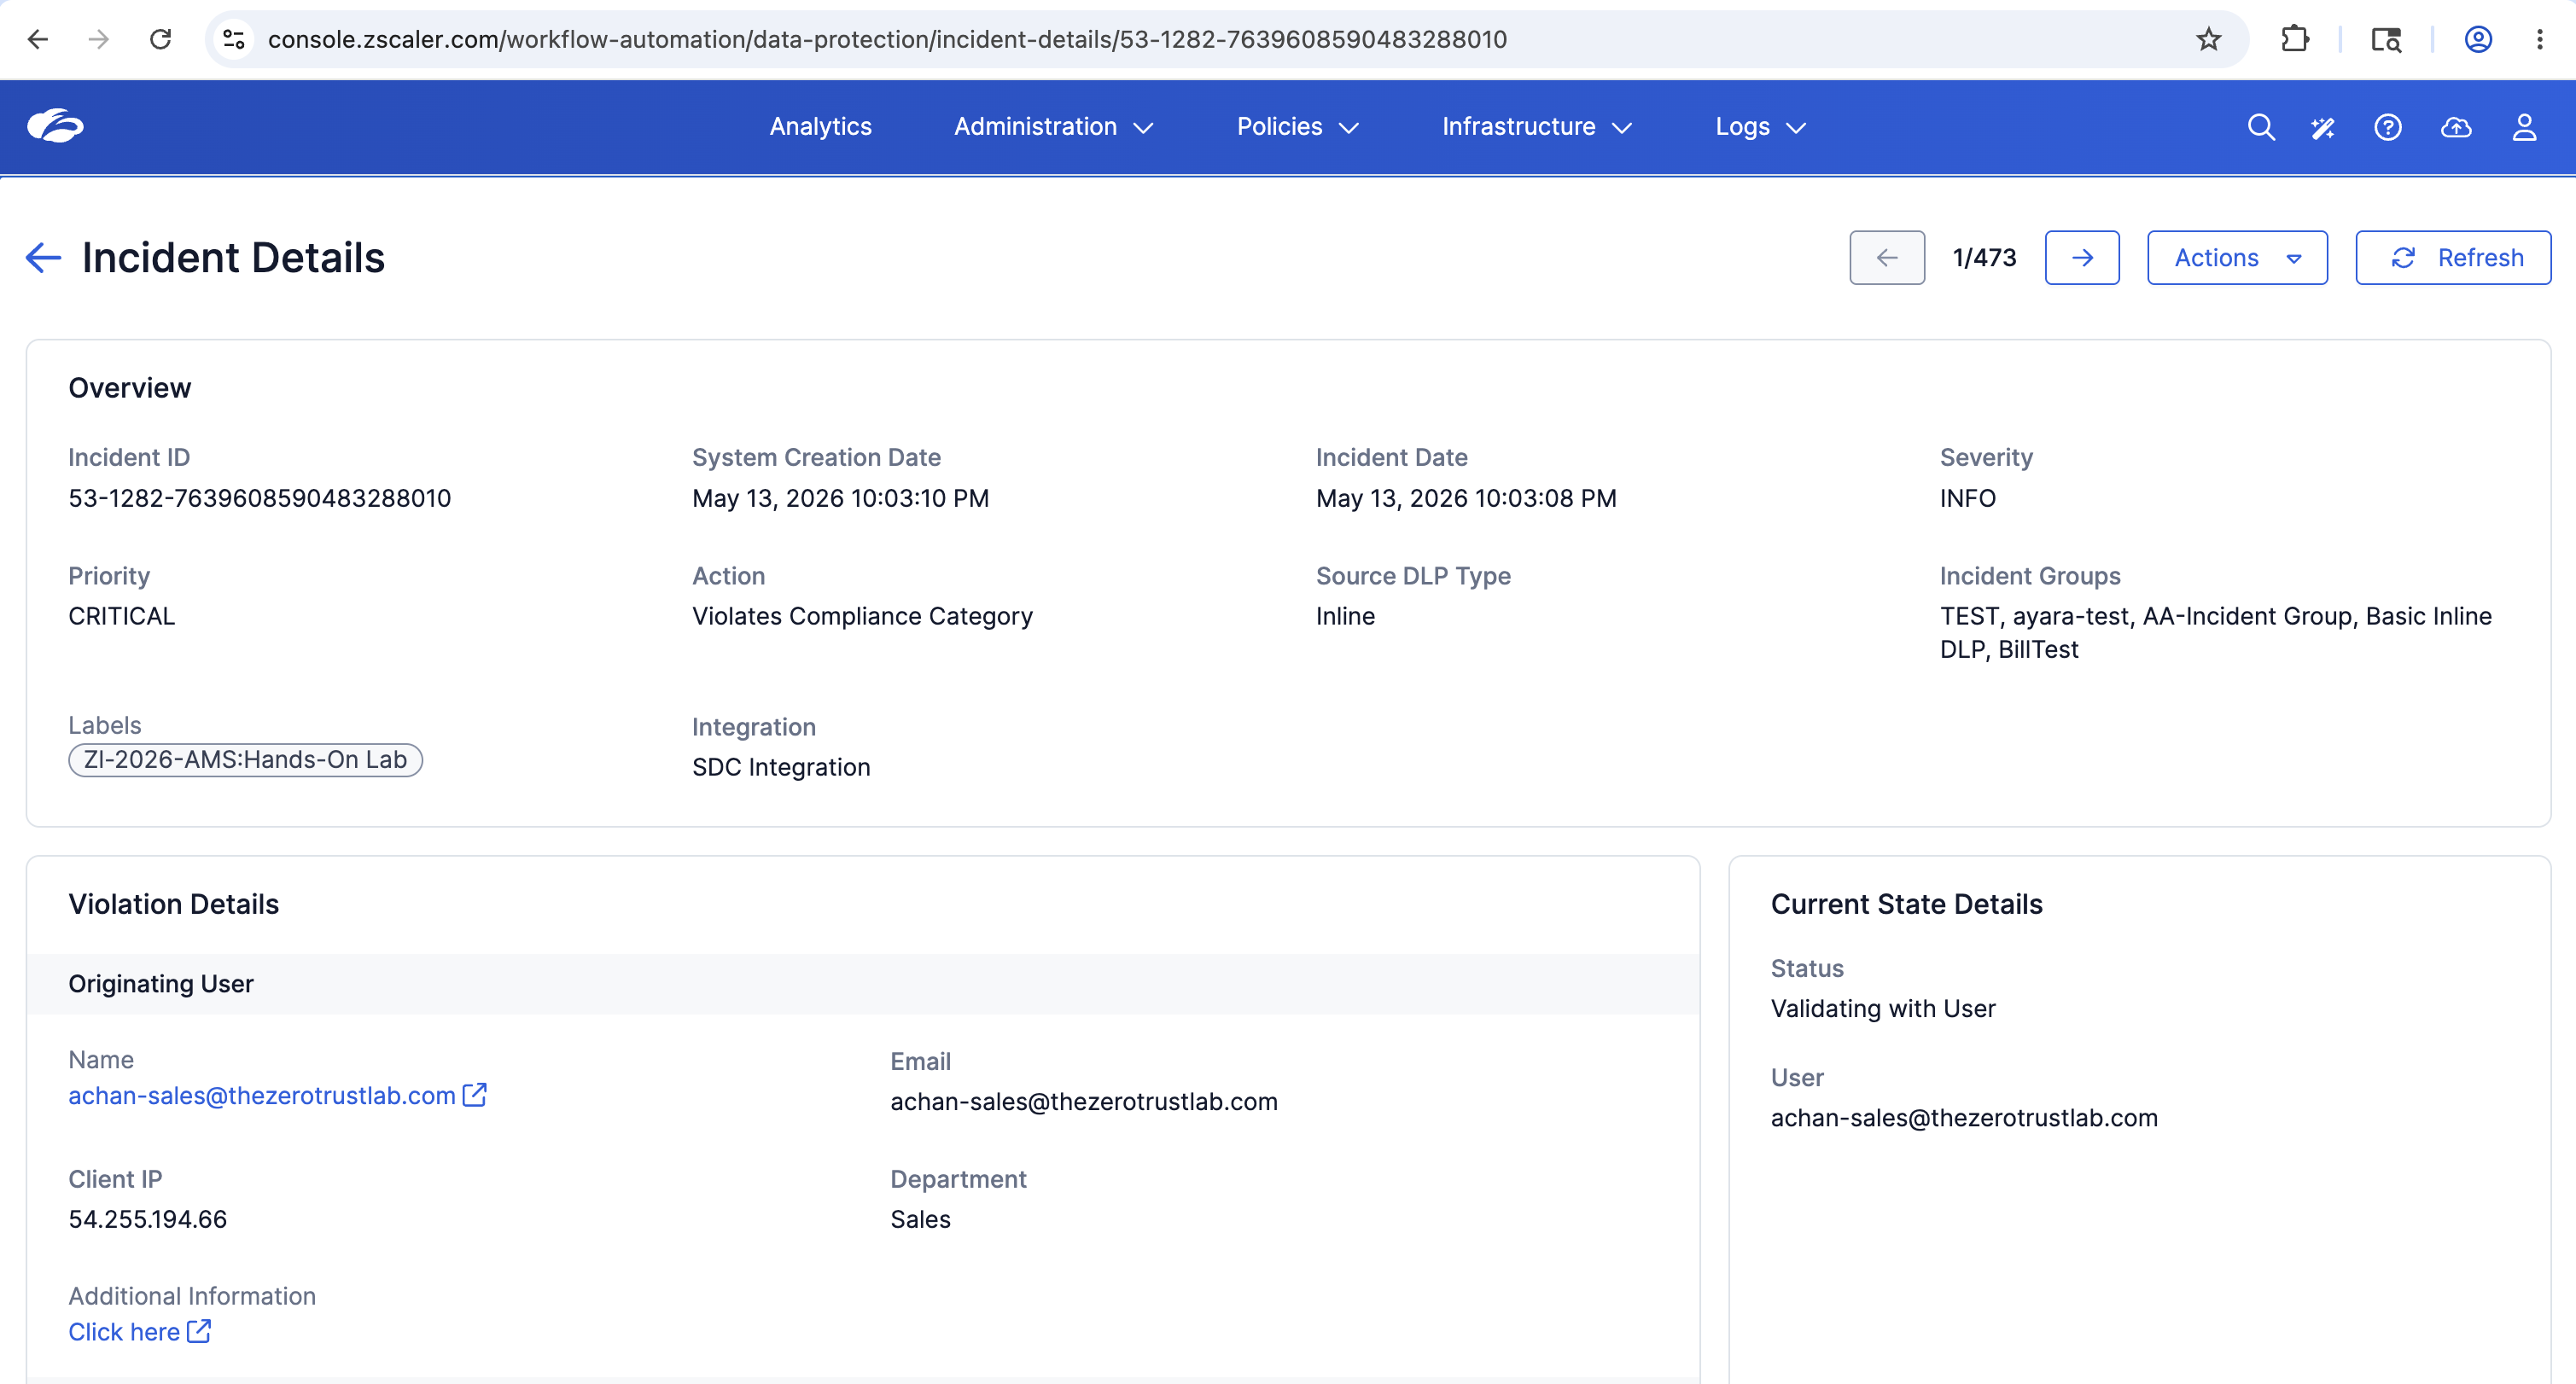
Click on Transaction ID 53-1282-7639608590483288010 — the top-of-queue Critical incident — to open its full detail view.
Read each section of the Overview panel:
| Field | Value |
|---|---|
| Incident ID | 53-1282-7639608590483288010 |
| System Creation Date | May 13, 2026 10:03:10 PM |
| Incident Date | May 13, 2026 10:03:08 PM |
| Severity | INFO |
| Priority | CRITICAL |
| Action | Violates Compliance Category |
| Source DLP Type | Inline |
| Incident Groups | TEST, ayara-test, AA-Incident Group, Basic Inline DLP, BillTest |
| Labels | ZI-2026-AMS:Hands-On Lab |
| Integration | SDC Integration |
Scroll to the Violation Details section:
| Field | Value |
|---|---|
| Name | achan-sales@thezerotrustlab.com |
| Client IP | 54.255.194.66 |
| Department | Sales |
| Status | Validating with User |
The Current State Details panel on the right confirms the incident is currently in Validating with User status — an automated workflow has already reached out to the originating user before Priya even opened this ticket.
Step 2 — Review the Policy and Content Sections
Scroll down to the Policy and Content panels.
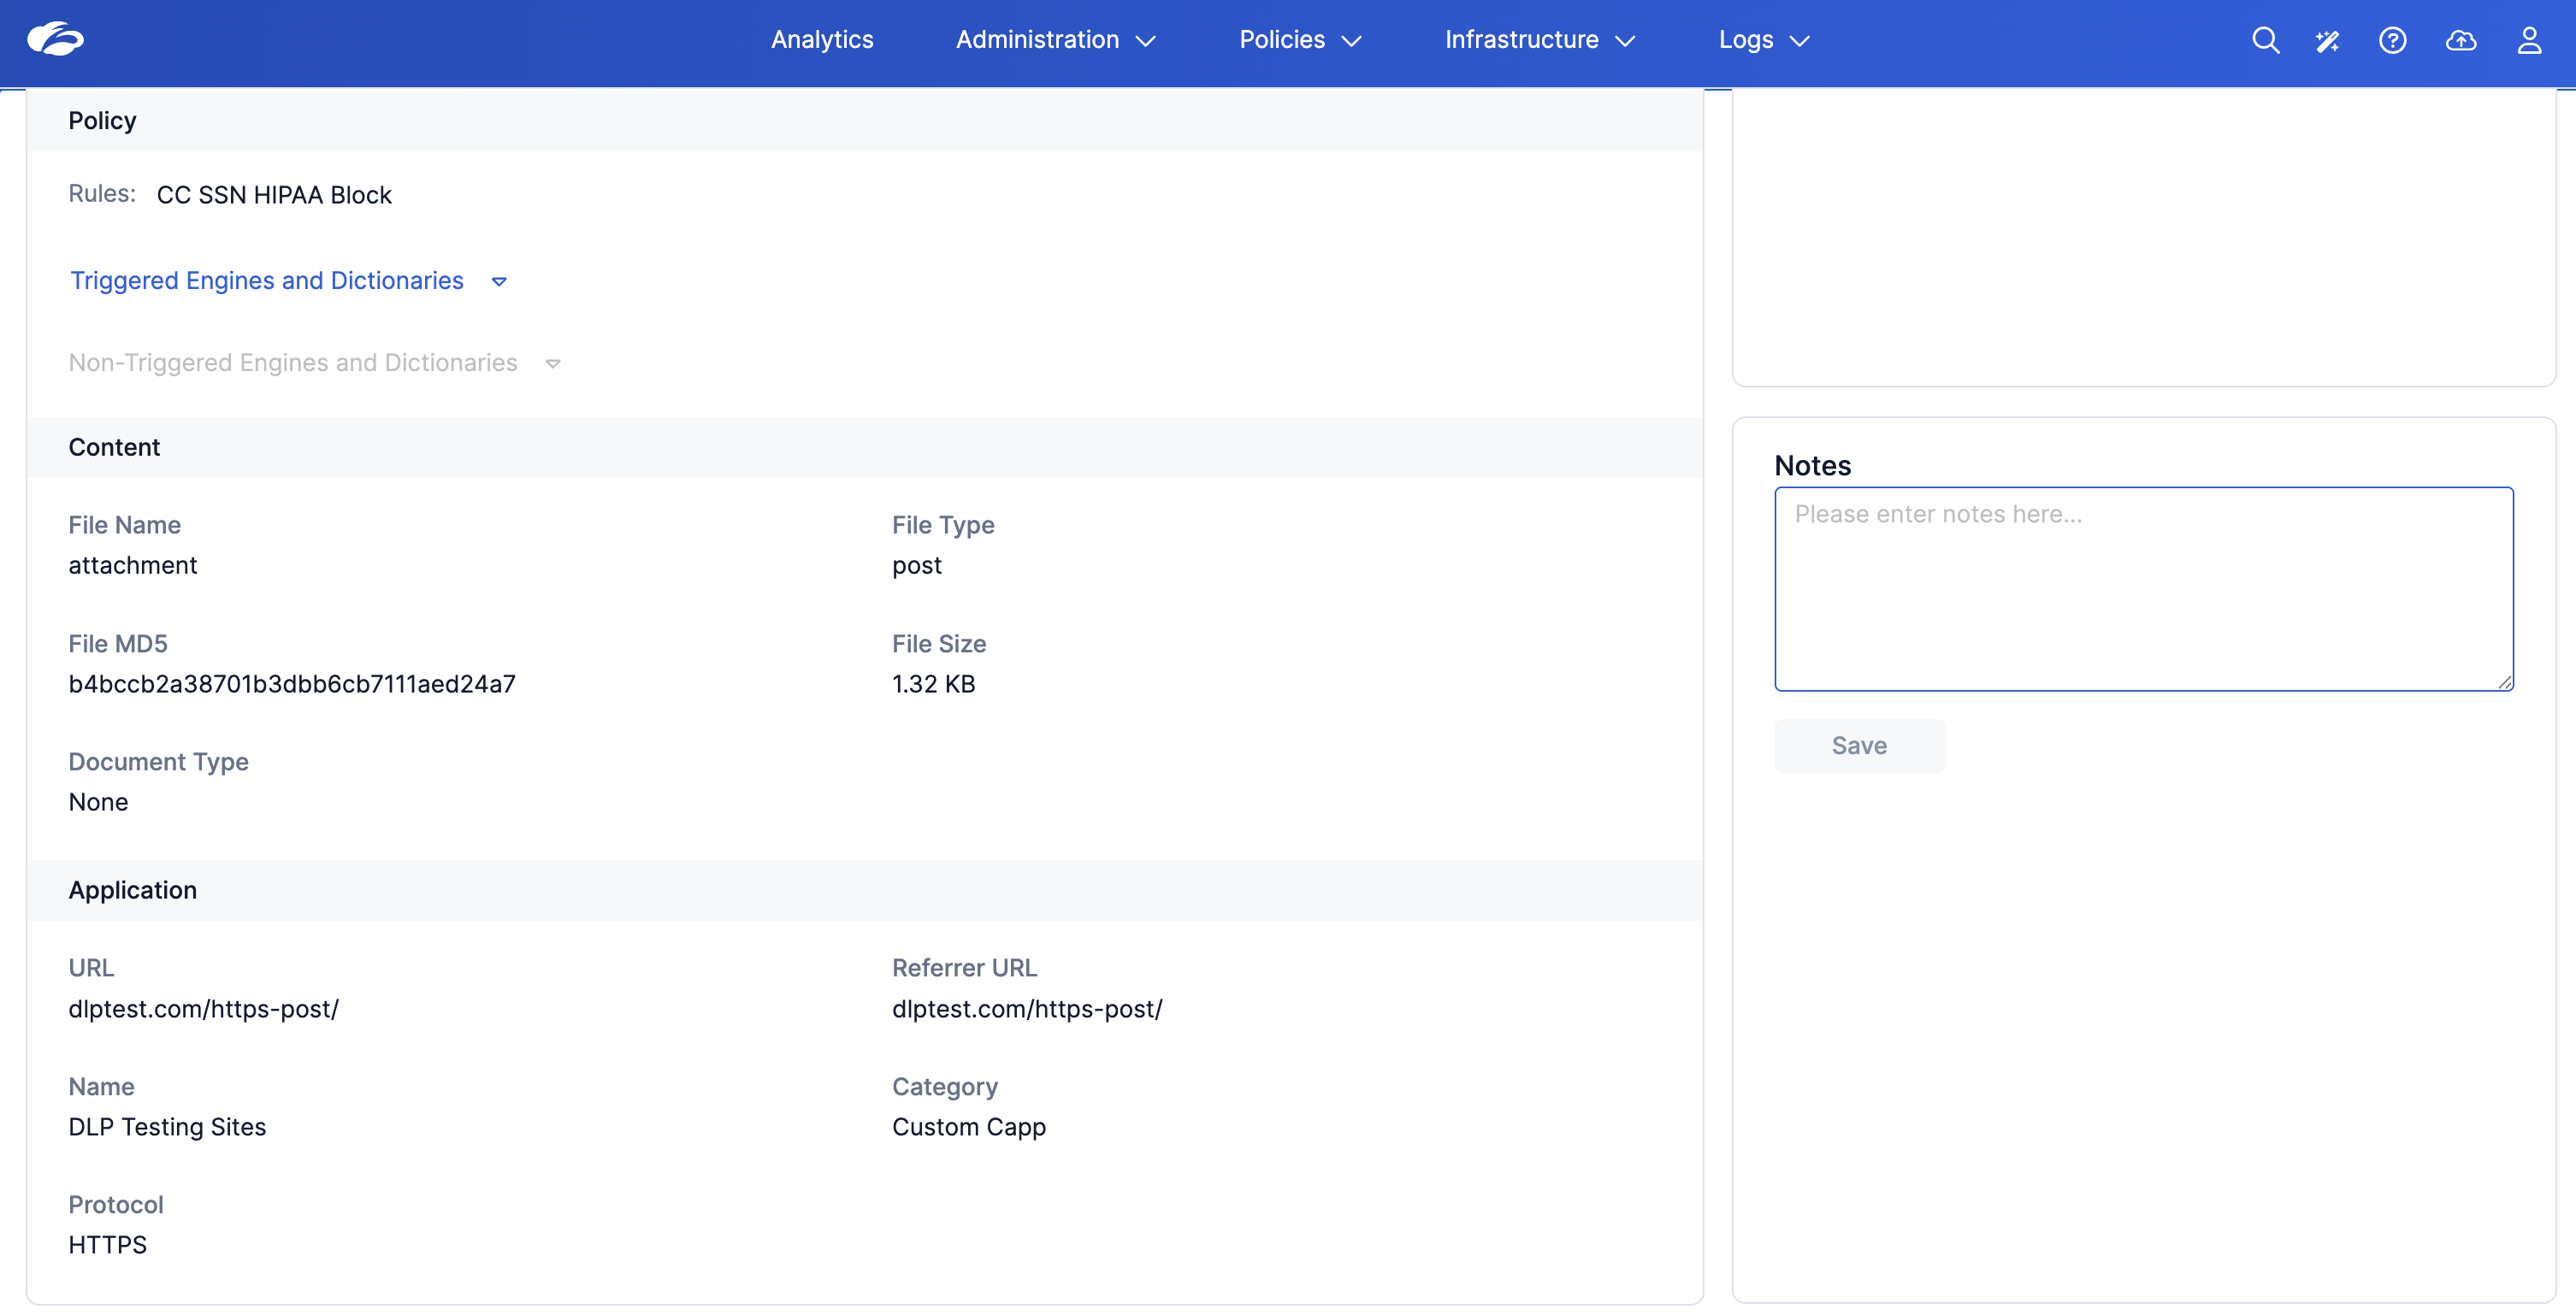
Policy section:
| Field | Value |
|---|---|
| Rules | CC SSN HIPAA Block |
| Triggered Engines | Expand to see which classification engines fired |
Content section:
| Field | Value |
|---|---|
| File Name | attachment |
| File Type | post |
| File MD5 | b4bccb2a38701b3dbb6cb7111aed24a7 |
| File Size | 1.32 KB |
| Document Type | None |
Application section:
| Field | Value |
|---|---|
| URL | dlptest.com/https-post/ |
| Referrer URL | dlptest.com/https-post/ |
| Name | DLP Testing Sites |
| Category | Custom Capp |
| Protocol | HTTPS |
The File MD5 hash is a pivotal forensic artefact. Priya can use this to verify whether the same file has appeared in multiple incidents, pivot into threat intelligence, or correlate with endpoint DLP logs.
Point out the Notes field on the right. SOC analysts can annotate incidents inline — no need to switch to a JIRA or ticket system just to add investigation notes. The notes persist in the audit trail.
Step 3 — Review Violation Content, User Notifications, and State Changes
Scroll further down to the Violation Content, User Notifications, and State Changes sections.
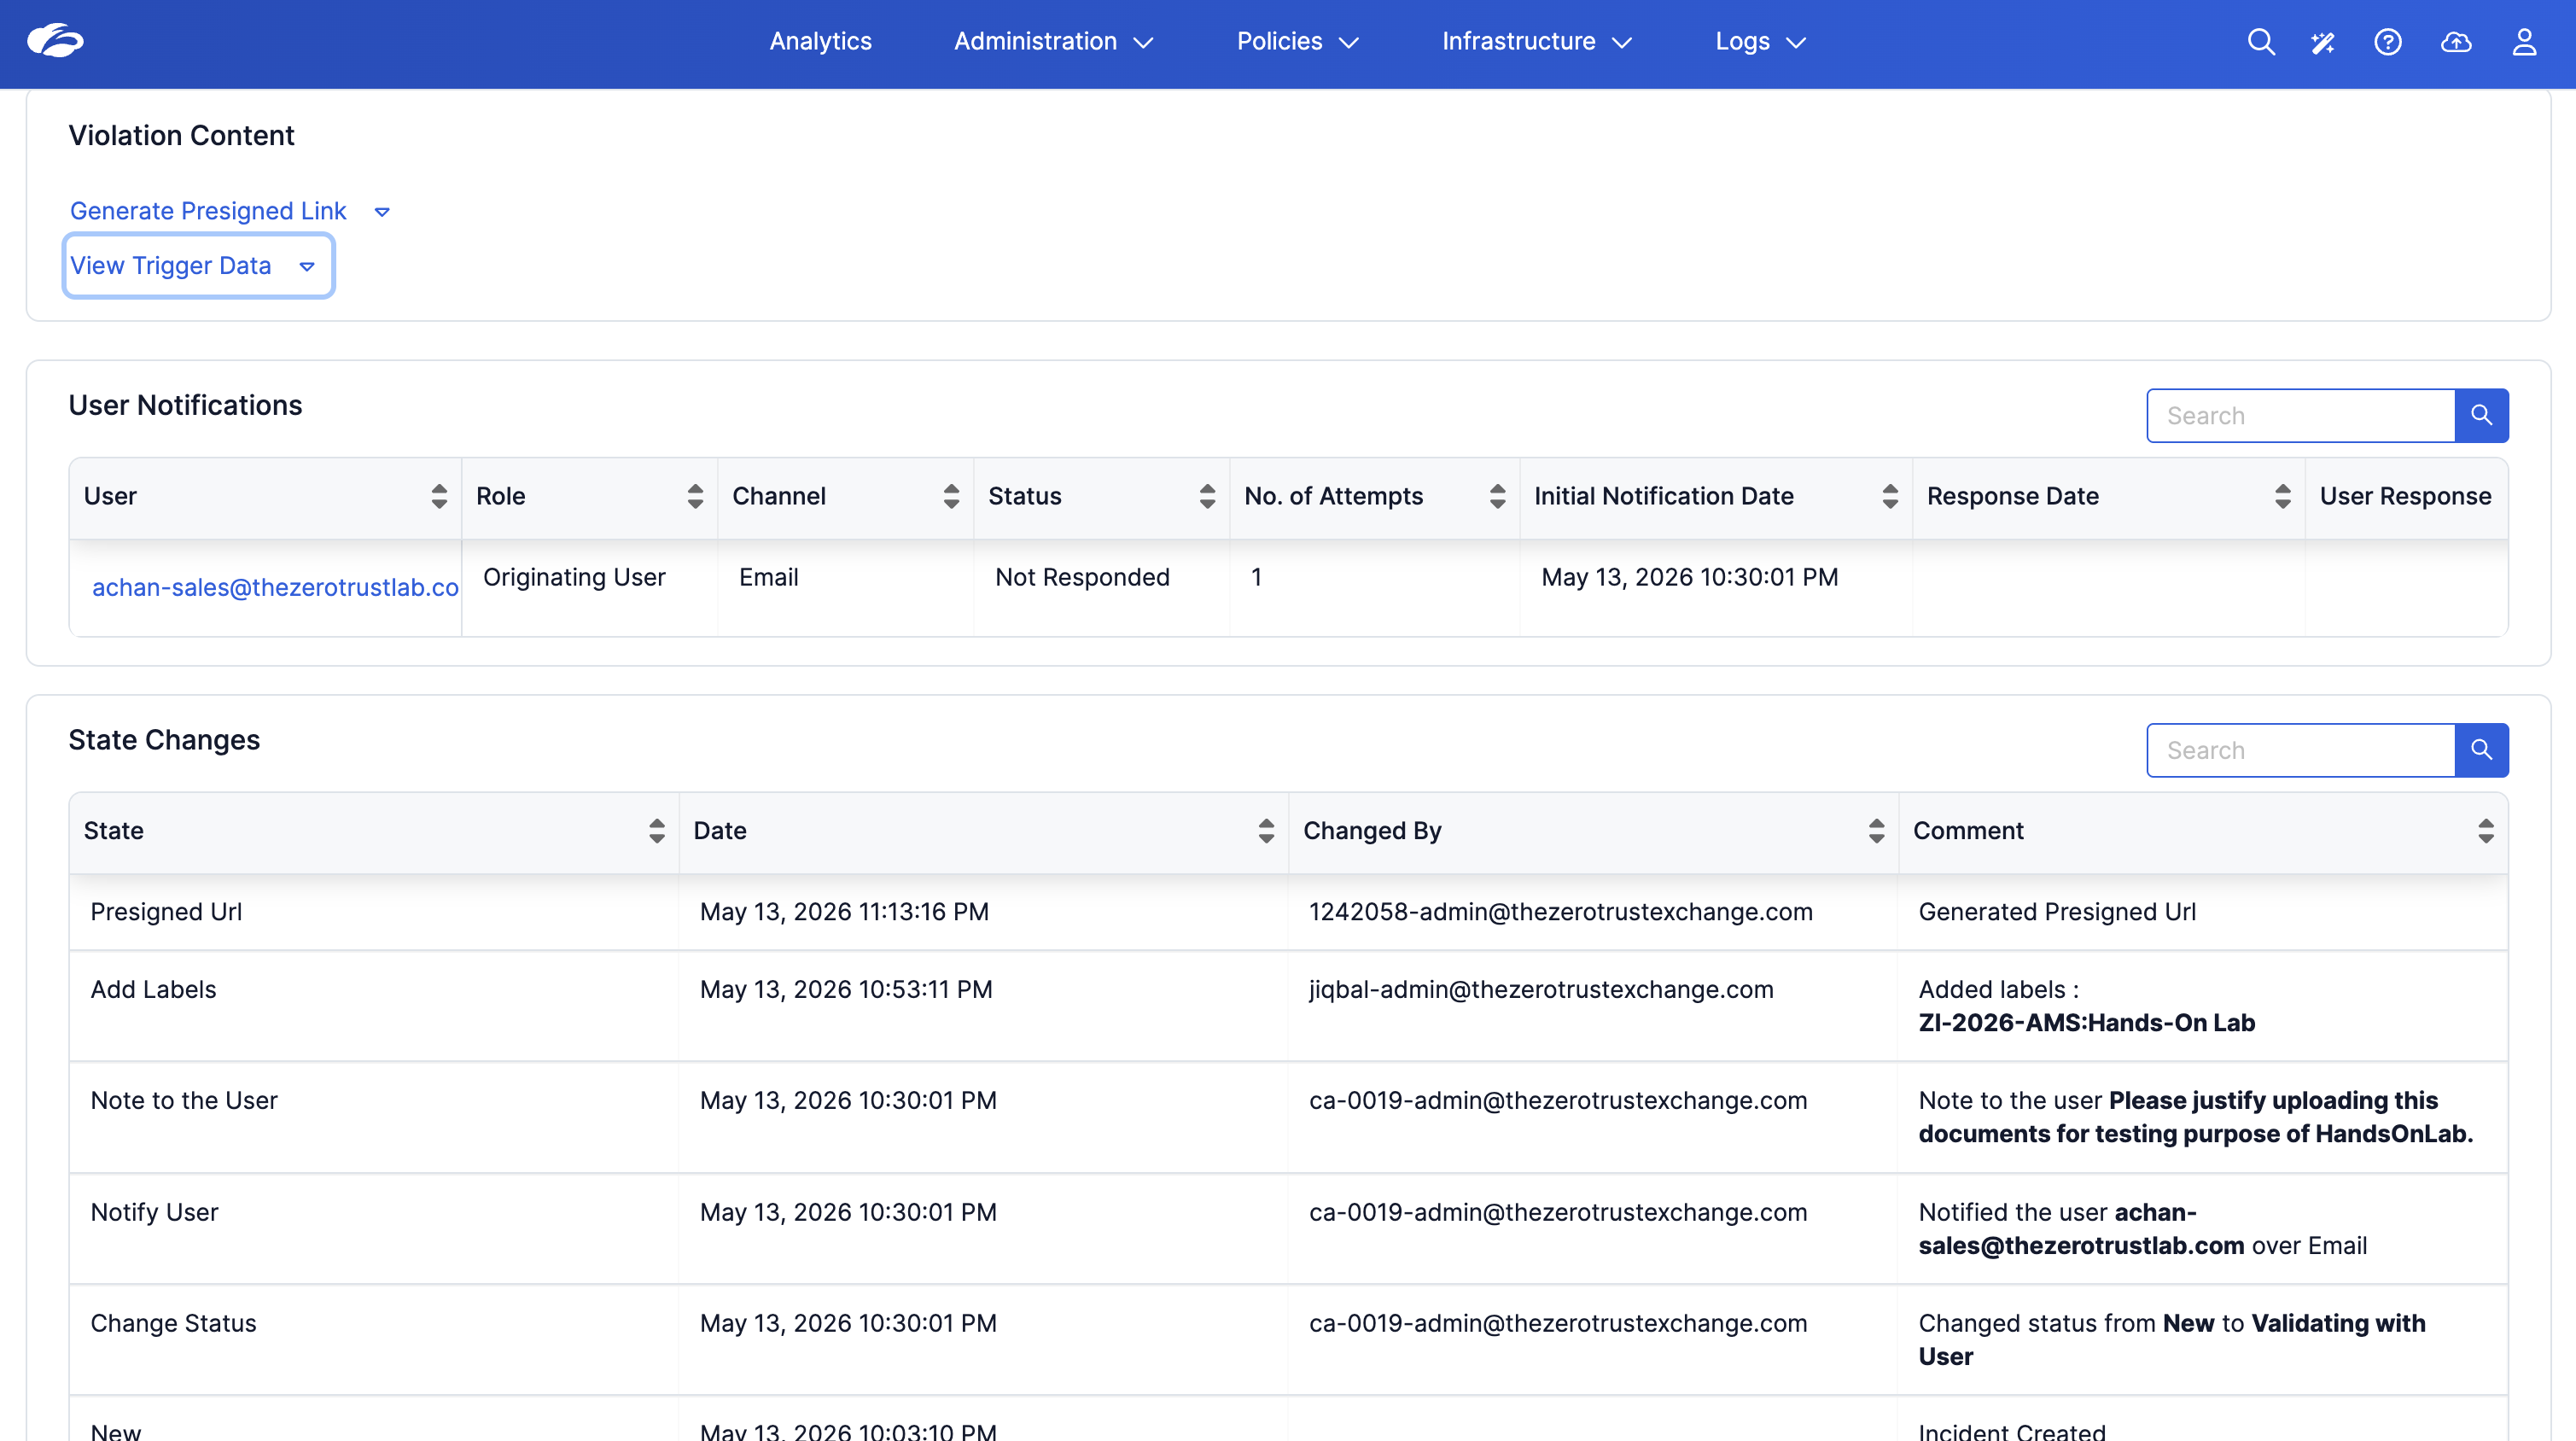
Violation Content:
- Generate Presigned Link — produces a time-limited URL to retrieve the actual violating file content (subject to tenant permissions).
- View Trigger Data — shows the raw data that fired the DLP engine, including matched content snippets and engine confidence scores.
User Notifications table:
| User | Role | Channel | Status | Attempts | Notified |
|---|---|---|---|---|---|
| achan-sales@thezerotrustlab.com | Originating User | Not Responded | 1 | May 13, 2026 10:30:01 PM |
State Changes audit trail (most recent first):
| State | Date | Changed By | Comment |
|---|---|---|---|
| Presigned Url | May 13 11:13 PM | 1242058-admin | Generated Presigned Url |
| Add Labels | May 13 10:53 PM | jiqbal-admin | Added label: ZI-2026-AMS:Hands-On Lab |
| Note to the User | May 13 10:30 PM | ca-0019-admin | Please justify uploading this document for testing purpose of HandsOnLab. |
| Notify User | May 13 10:30 PM | ca-0019-admin | Notified achan-sales over Email |
| Change Status | May 13 10:30 PM | ca-0019-admin | Changed status: New to Validating with User |
| New | May 13 10:03 PM | System | Incident Created |
The State Changes log is a complete, tamper-evident audit trail. Every automated workflow action, every manual analyst decision, and every system event is timestamped and attributed — meeting e-discovery and compliance requirements out of the box.
Task 4 — Explore Available Actions
Return to the top of the Incident Details page and click the Actions drop-down to see the full set of manual response options available to Priya.
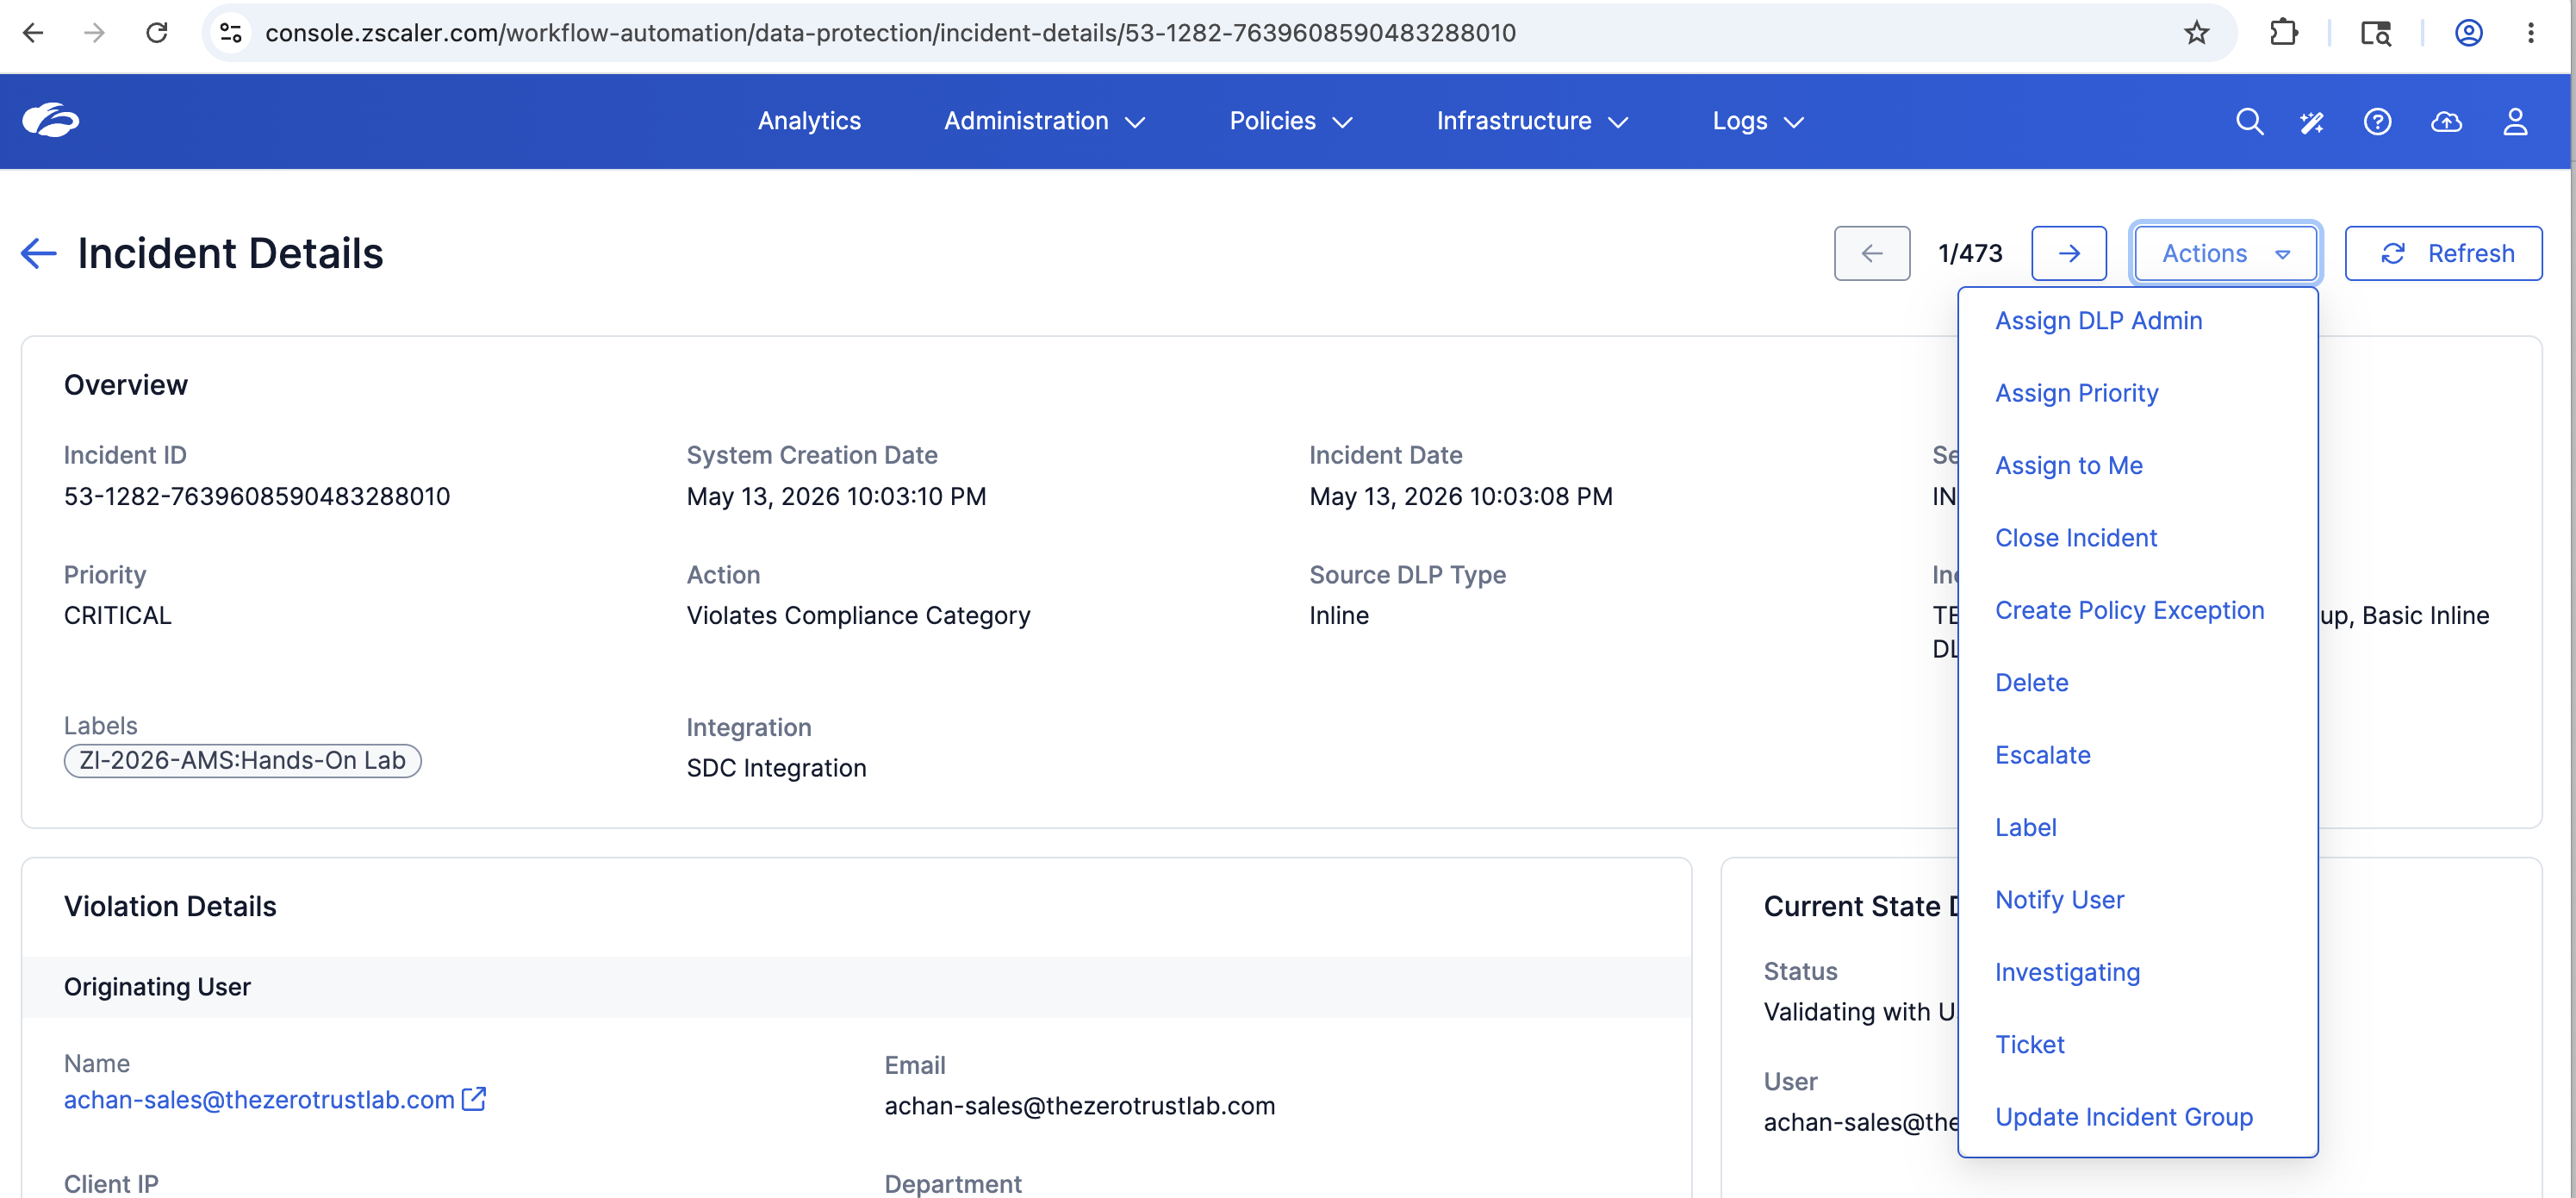
| Action | Description |
|---|---|
| Assign DLP Admin | Route incident to a named DLP administrator |
| Assign Priority | Manually override the system-calculated priority |
| Assign to Me | Claim the incident for personal investigation |
| Close Incident | Mark the incident as resolved and close it |
| Create Policy Exception | Allow the triggering pattern for this user or content type going forward |
| Delete | Remove the incident record (audited) |
| Escalate | Bump to senior analyst or management queue |
| Label | Tag the incident for reporting or grouping |
| Notify User | Send a manual notification/survey to the originating user |
| Investigating | Set status to indicate active analyst review |
| Ticket | Create a linked ticket in an integrated ITSM (e.g., ServiceNow) |
| Update Incident Group | Move incident to a different incident group |
The Ticket action is the ServiceNow integration touchpoint — this is where Lab 5's detection engine and Lab 9's SOC triage connect to the broader ITSM workflow. If you demonstrated the ServiceNow incident creation demo earlier, this is the moment to close that loop: Zscaler doesn't just detect and block, it feeds directly into the SOC's ticketing workflow.
Task 5 — Explore Workflow Templates
So far Priya has performed manual triage actions — reviewing, filtering, and exploring incident details. But in a real SOC handling hundreds of incidents per day, manual triage at scale is not sustainable. Workflow Templates let Priya automate the response actions she just performed manually.
Steps
Step 1 — Navigate to Workflow Templates
In the left rail of Workflow Automation, expand Workflows and click Workflow Templates.
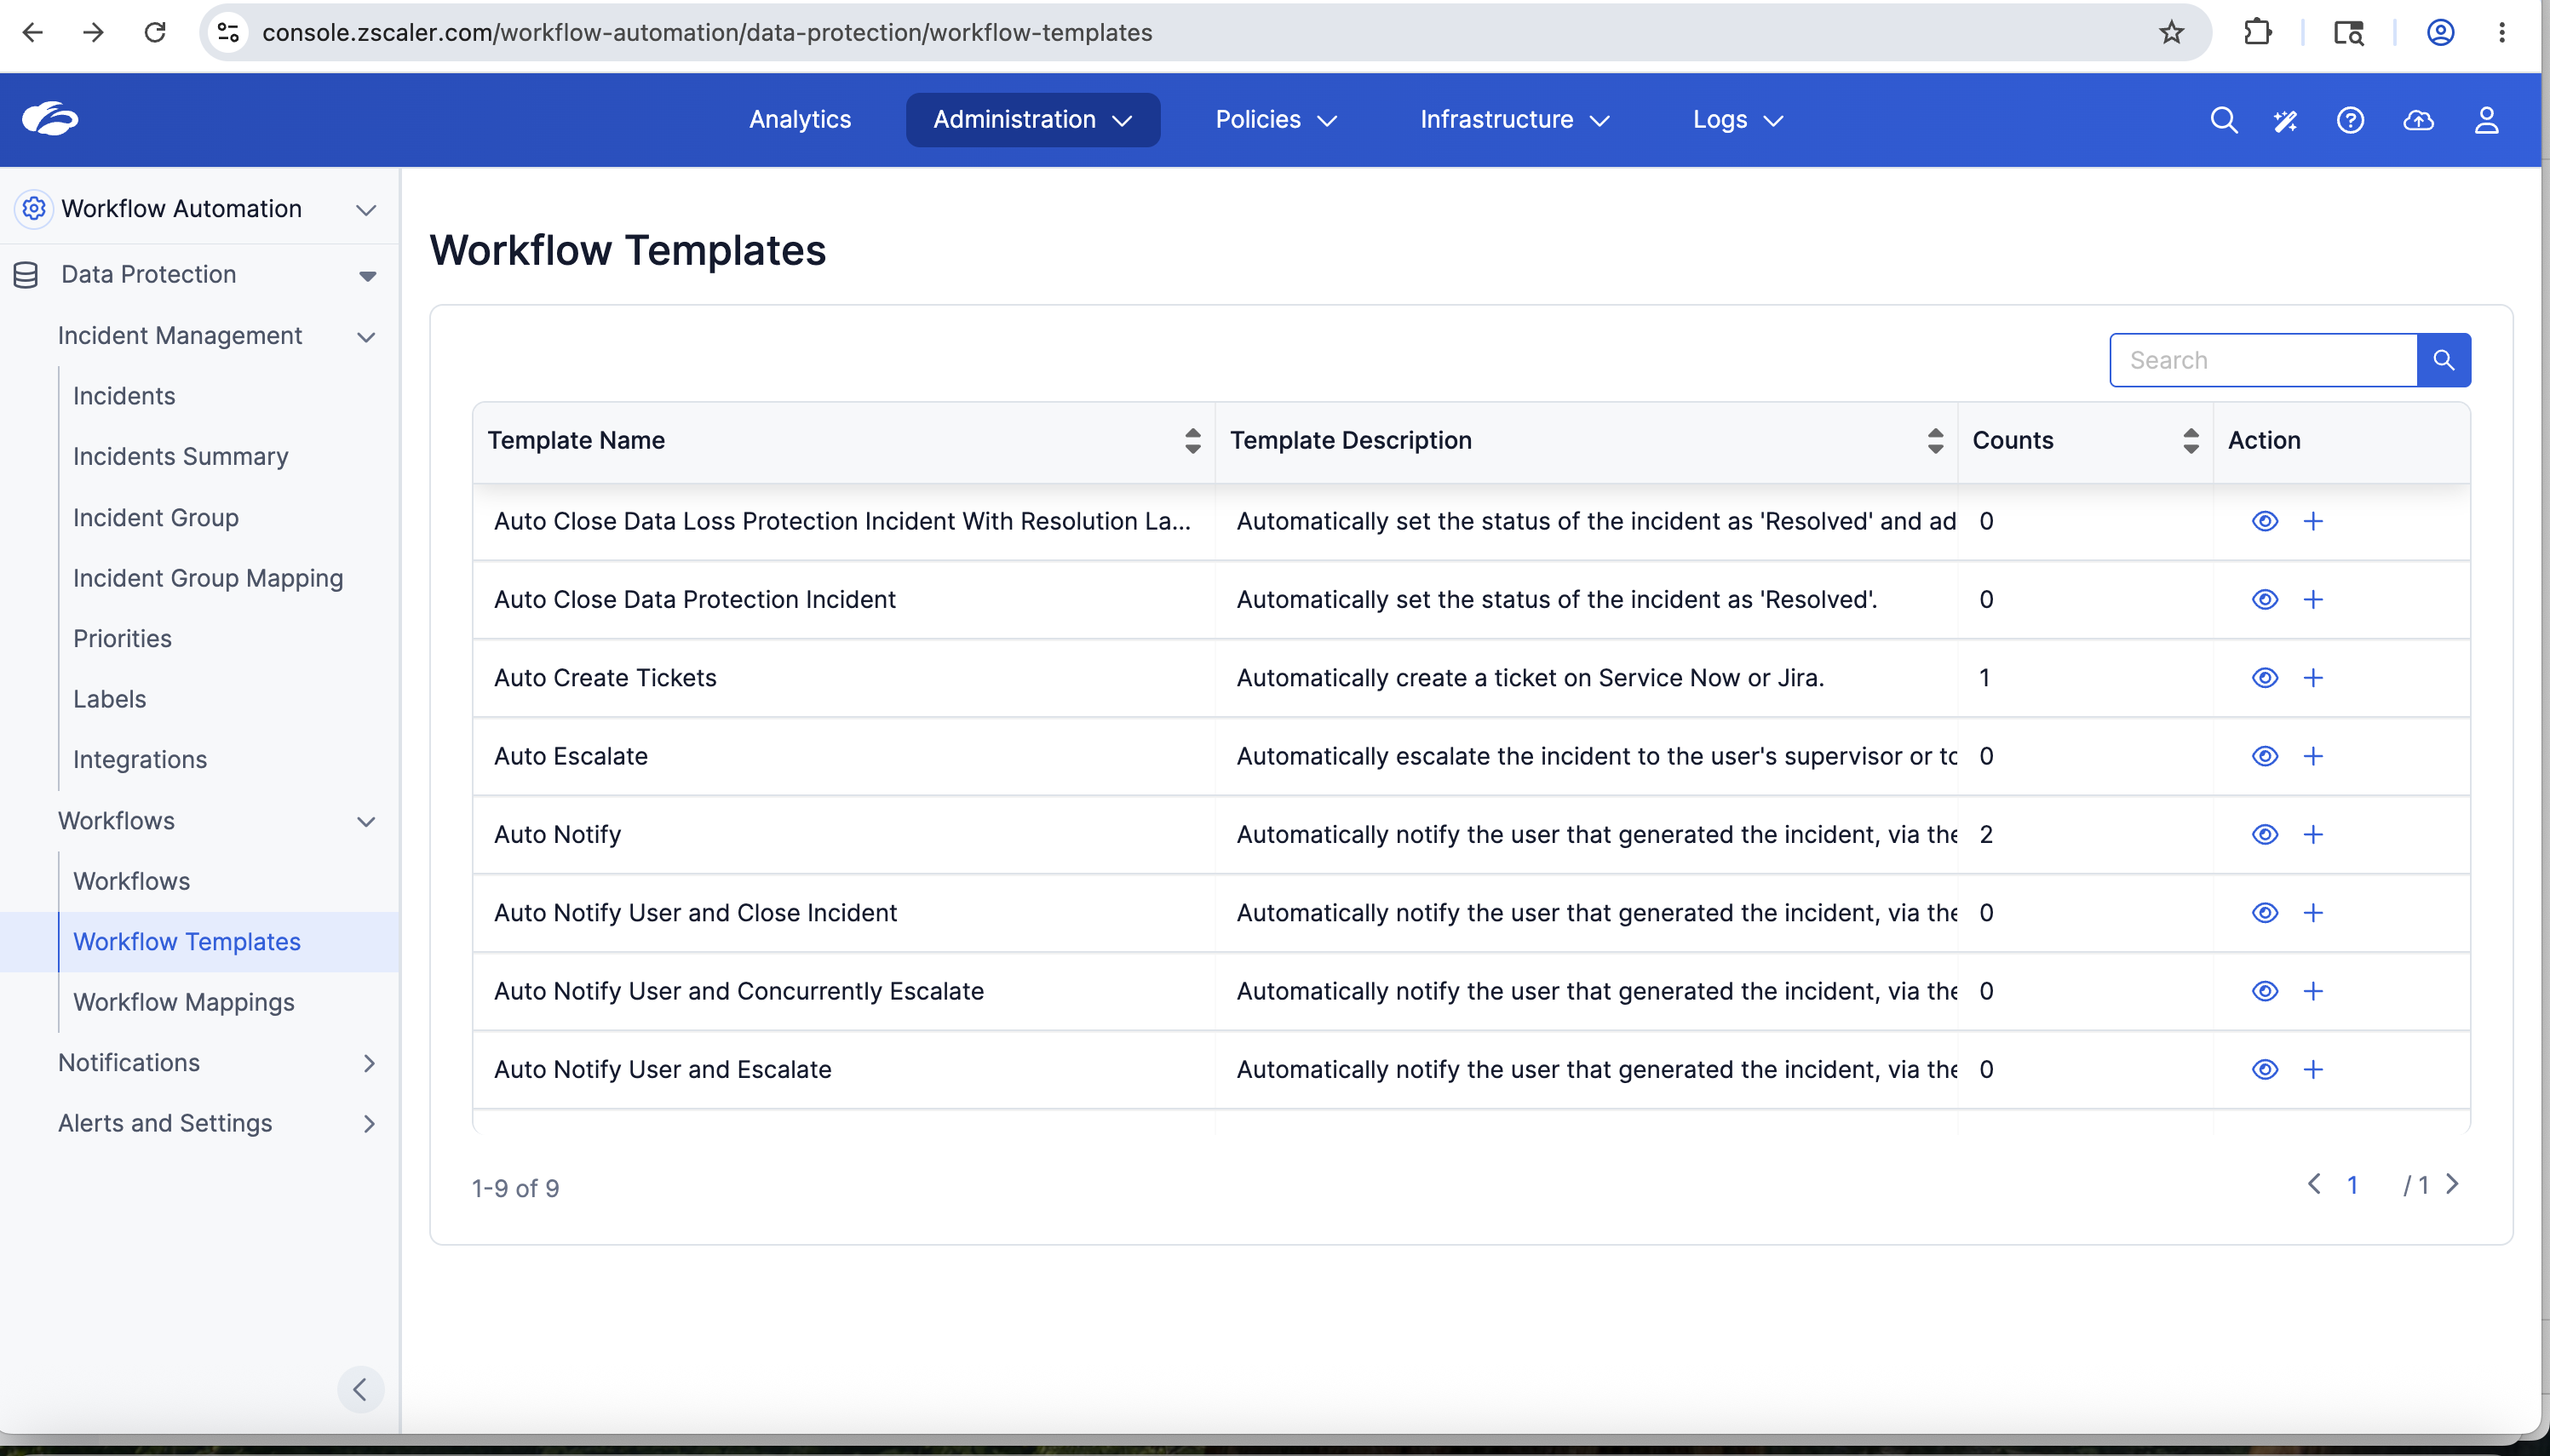
Review the 9 available templates:
| Template Name | Description |
|---|---|
| Auto Close Data Loss Protection Incident With Resolution La... | Automatically resolves the incident and adds a resolution label |
| Auto Close Data Protection Incident | Automatically sets status to Resolved |
| Auto Create Tickets | Automatically creates a ticket in ServiceNow or Jira |
| Auto Escalate | Automatically escalates to the user's supervisor or approver |
| Auto Notify | Automatically notifies the originating user via the configured channel |
| Auto Notify User and Close Incident | Notifies user then closes the incident in one step |
| Auto Notify User and Concurrently Escalate | Notifies user and escalates simultaneously |
| Auto Notify User and Escalate | Notifies user first, then escalates |
Notice the Counts column — this shows how many active workflow mappings reference each template. Auto Create Tickets has 1 active mapping and Auto Notify has 2 — meaning those workflows are already firing automatically on matching incidents.
Ask the group: which of these templates maps to the manual actions Priya just performed? The answer is Auto Notify (she sent a notification) and Auto Escalate (she explored escalation in the Actions menu). Everything Priya did manually in Task 4 can be codified as an automated response triggered the moment an incident is created — with no analyst intervention required for routine cases.
Step 2 — Preview the Auto Notify User and Concurrently Escalate Template
Click the eye icon next to Auto Notify User and Concurrently Escalate to open the workflow preview.
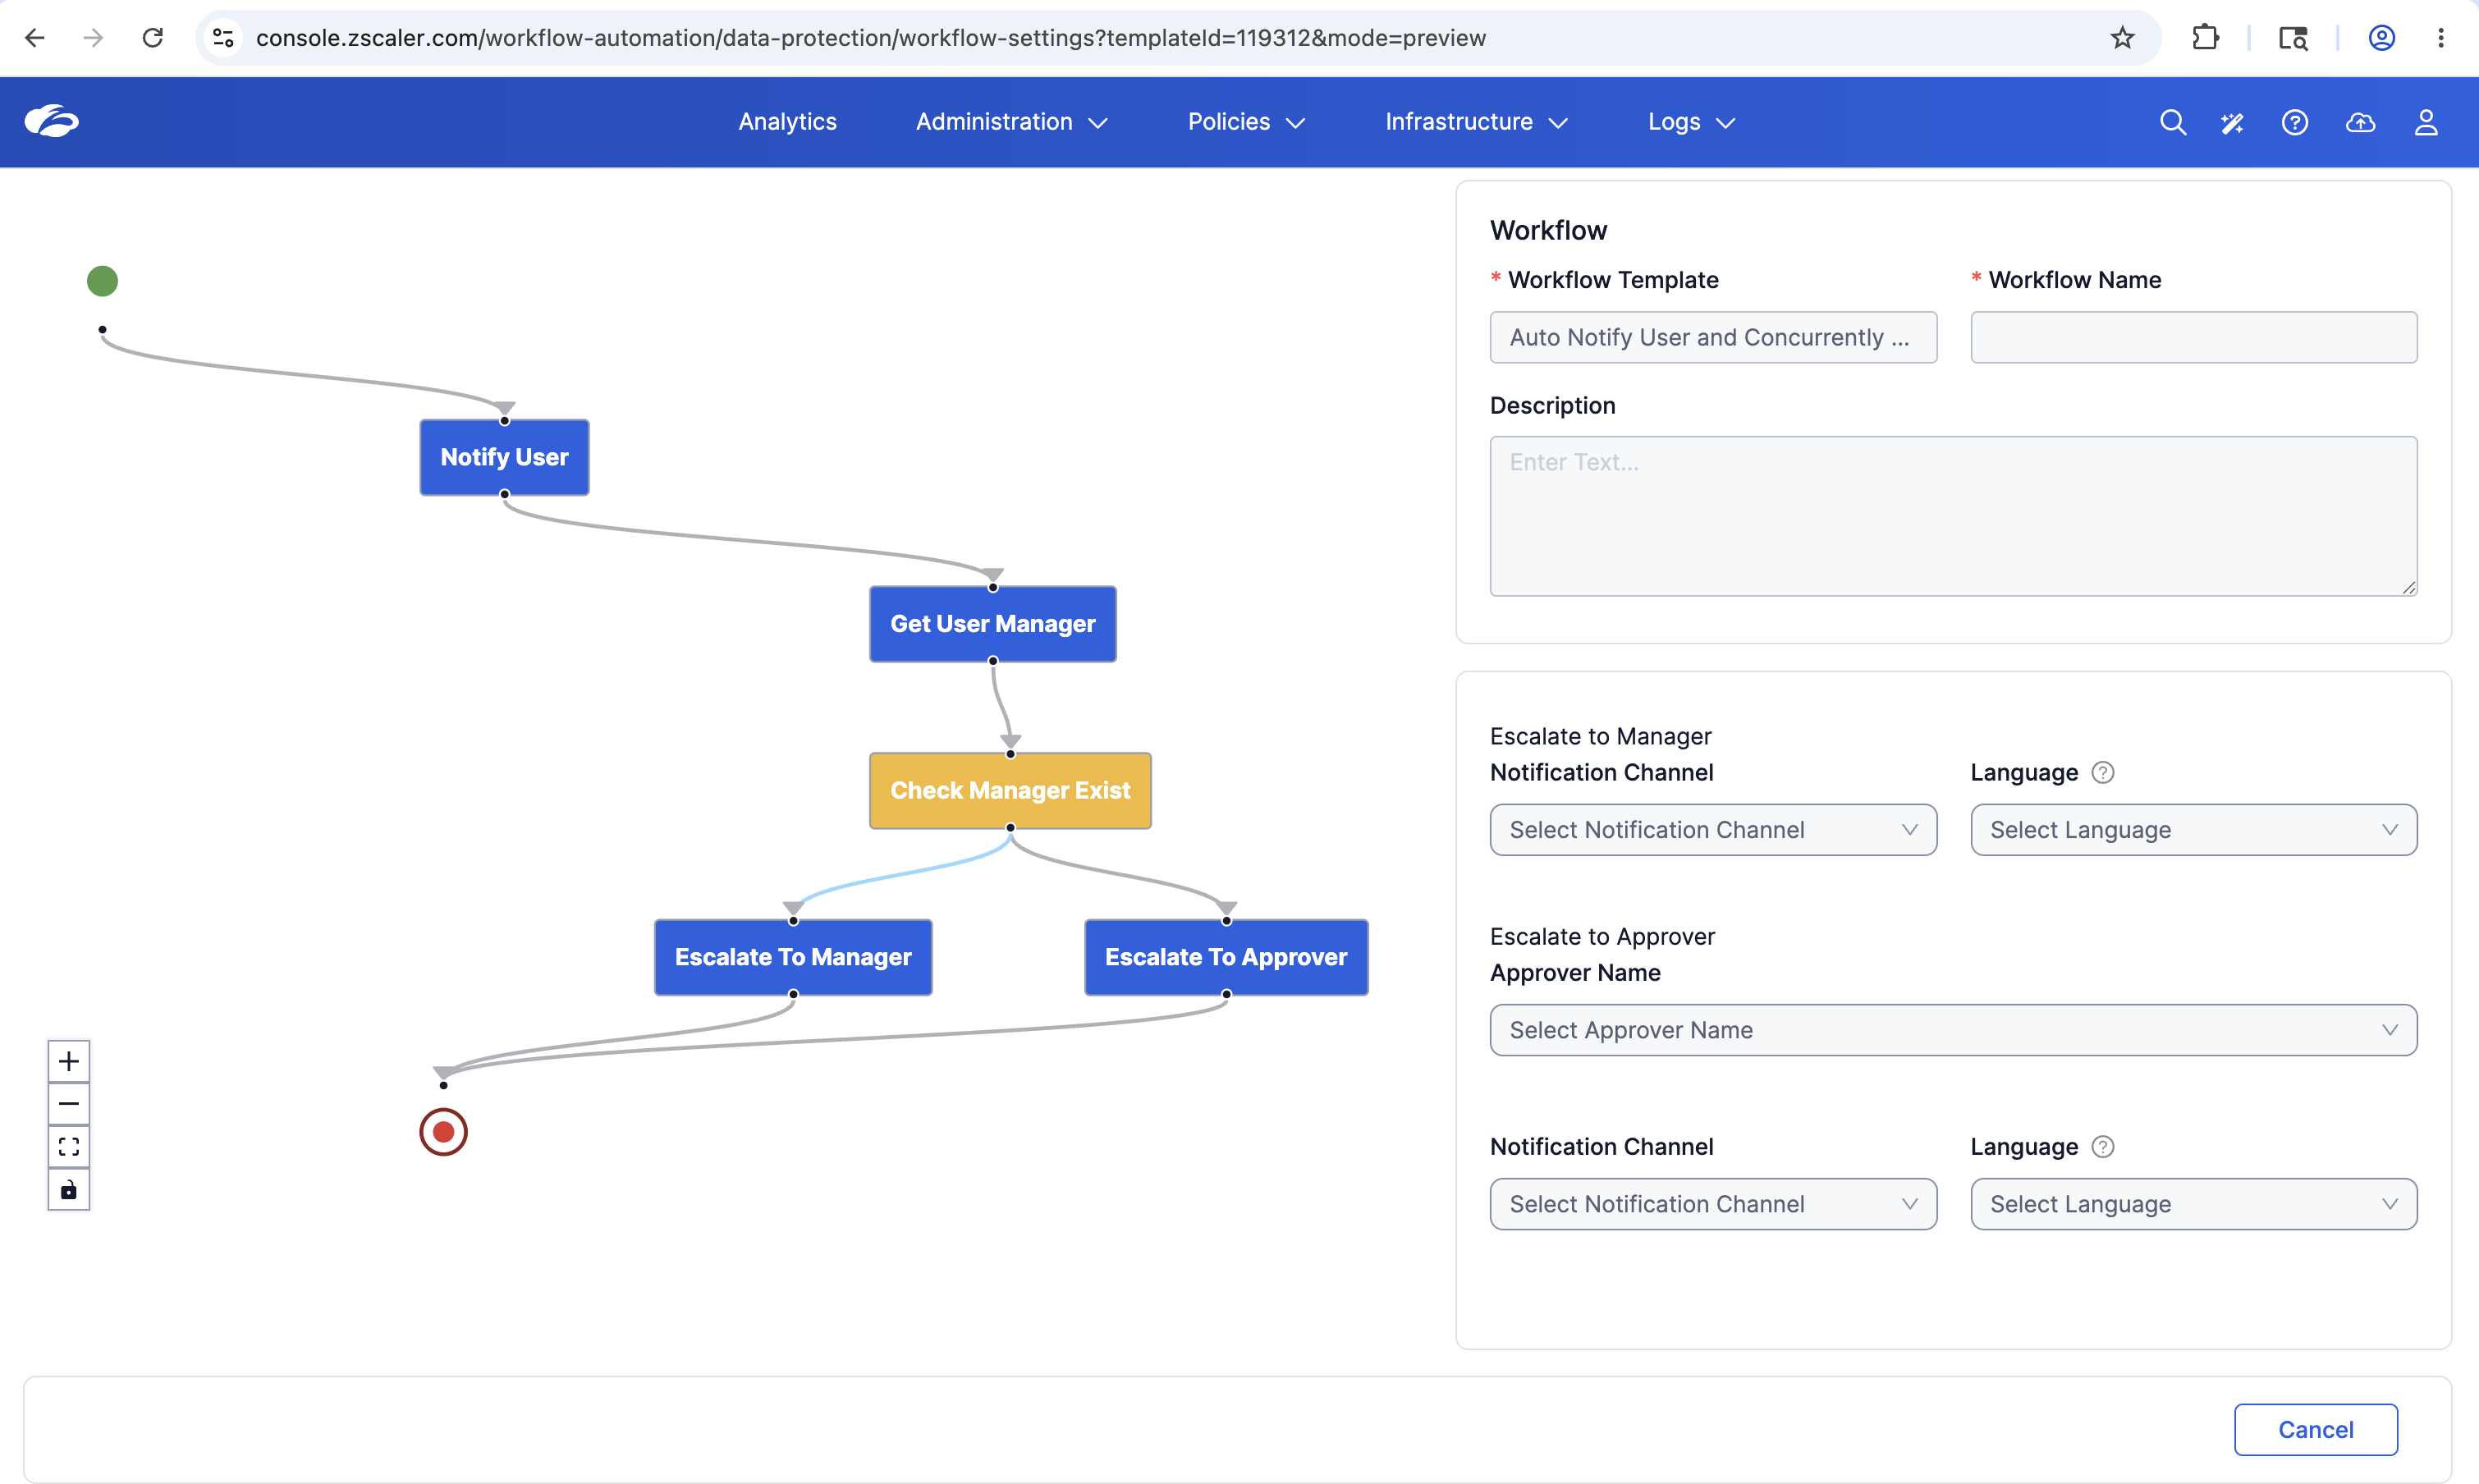
Read the visual workflow diagram:
| Node | Description |
|---|---|
| Start | Triggered when a matching incident is created |
| Notify User | Sends notification to the originating user |
| Get User Manager | Looks up the user's manager in the directory |
| Check Manager Exist | Decision node — does this user have a manager configured? |
| Escalate to Manager | If manager found — escalates to the user's direct manager |
| Escalate to Approver | If no manager — escalates to a pre-configured approver |
| End | Workflow completes |
The right panel shows the configurable settings:
- Escalate to Manager — Notification Channel + Language
- Escalate to Approver — Approver Name + Notification Channel + Language
This single template replaces what would otherwise be a multi-step manual process: notify, look up manager, escalate, confirm. It executes in seconds, automatically, for every incident that matches the workflow mapping criteria.
This is the closing moment for the entire lab session. Connect the dots explicitly: Alex built detection logic (Lab 5) that defined what sensitive data looks like. Kevin triggered violations across three channels (Labs 6, 7, 8). The proxy blocked the exfiltration and generated incidents. Priya triaged those incidents here in WFA. And now Workflow Templates show how the entire response chain — notify, escalate, ticket, close — can run automatically at scale. That is the complete Zscaler data security lifecycle: See, Know, Protect, Respond.
Lab Summary
In this lab, Priya used Workflow Automation to perform a complete SOC triage cycle without leaving the Zscaler console:
- Navigated to the Incidents queue via Administration → Workflow Automation
- Assessed the incident queue health — 473 total, 443 open, 30 awaiting user feedback
- Filtered by Source DLP Type to isolate Inline and Endpoint incidents in a single view
- Drilled into a Critical incident and read the full violation context — user, IP, department, file hash, application, policy rule
- Reviewed the automated State Changes trail showing every action taken since the incident was created
- Explored the 12 available Actions for manual response, including escalation, policy exception, and ITSM ticketing
- Discovered Workflow Templates — 9 pre-built automated response workflows that replace manual triage at scale
Key Takeaway: Workflow Automation is not a passive log viewer. It is an active SOC workspace where detection, investigation, user notification, and automated response all converge — replacing the multi-tool, multi-console workflow most security teams operate today. The State Changes audit trail and Workflow Templates together deliver both compliance evidence and operational efficiency.