Lab 3 — Endpoint Data Visibility
The steps are a starting point. Explore available filters, tabs, linked records, information icons, and View All options. Try other users, departments, application categories, and device types.
1. Open the Endpoint Data Scan Dashboard
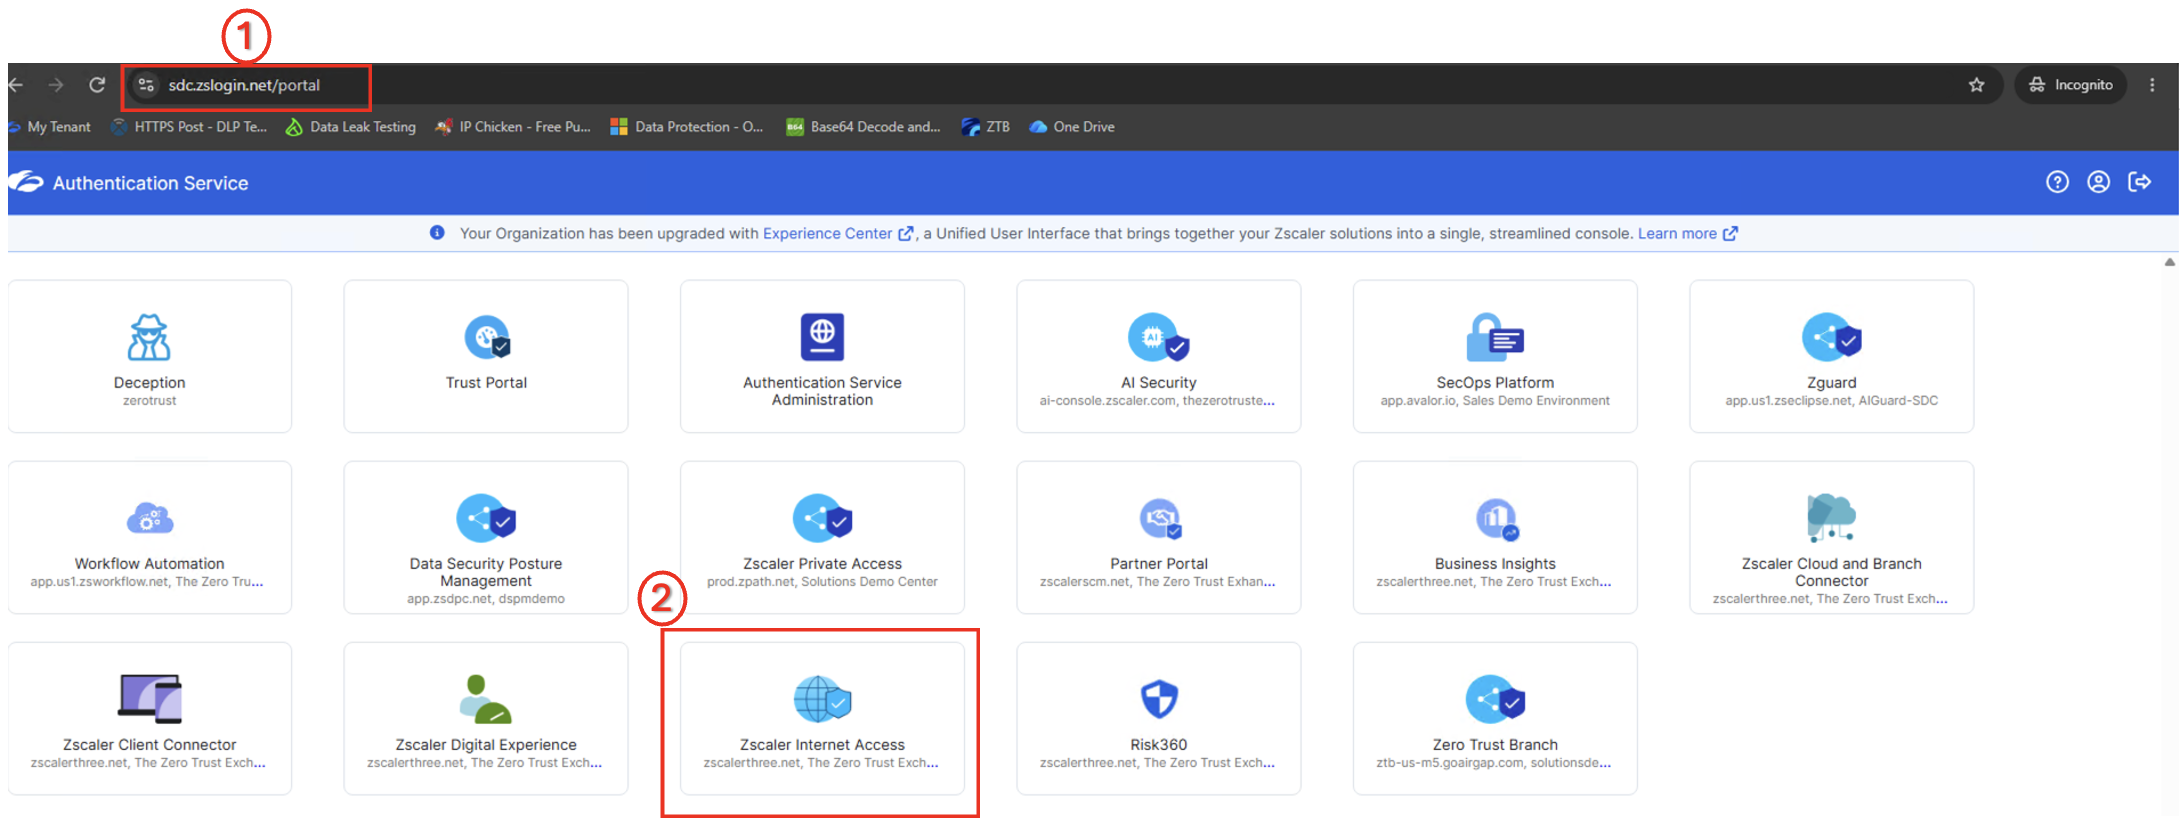
Step 1 — Launch Zscaler Internet Access
Log in to the Solution Demo Centre portal at sdc.zslogin.net/portal, then select Zscaler Internet Access.
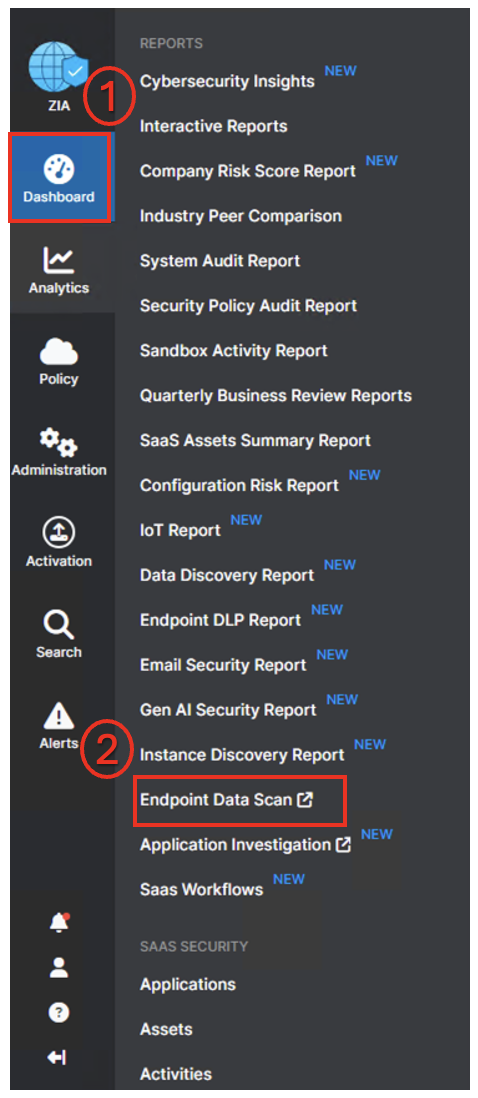
Step 2 — Navigate to Endpoint Data Scan
In the ZIA console, open Dashboard and select Endpoint Data Scan under Reports.
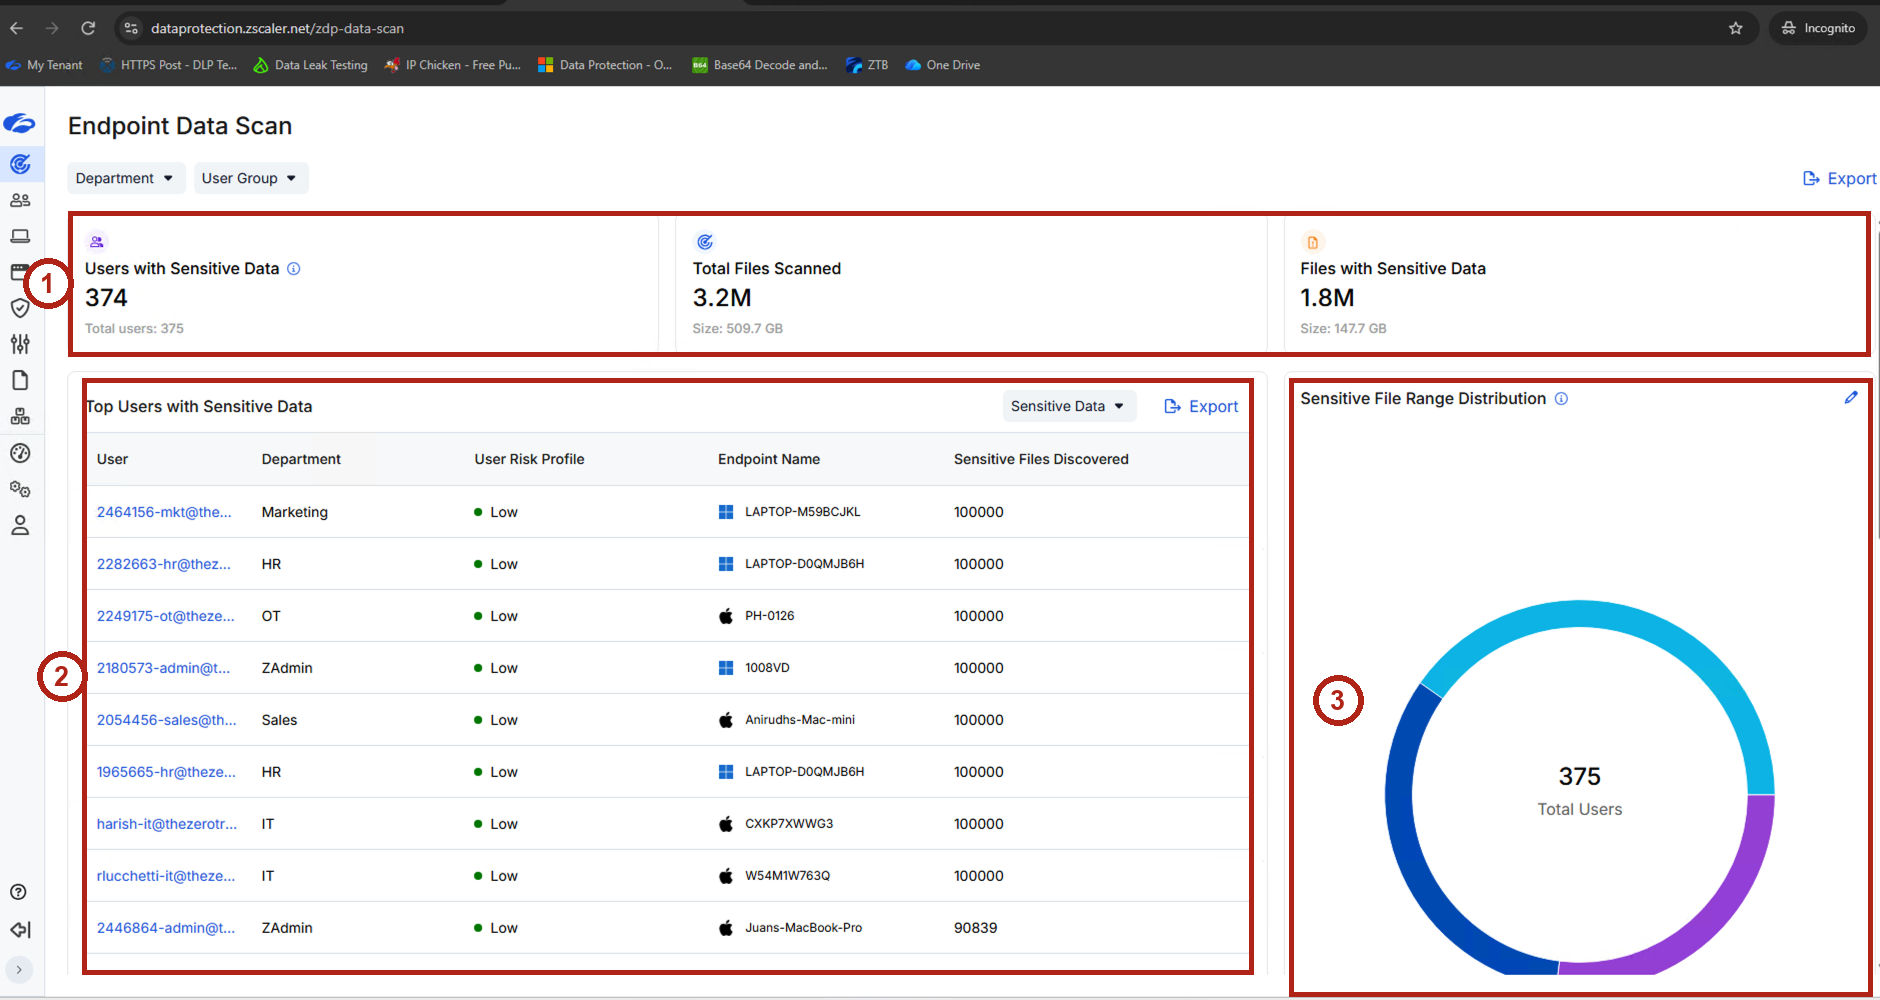
Step 3 — Review the Dashboard Layout
Locate the summary tiles, Top Users with Sensitive Data, and Sensitive File Range Distribution.
2. Review the Endpoint Data Posture
Step 4 — Review the Summary Tiles
Review the three summary tiles at the top of the dashboard. Numbers may vary on your dashboard. Values shown below are screenshot examples, not expected results.

| Tile | Screenshot example | What it shows |
|---|---|---|
| Users with Sensitive Data | 374 of 375 users | Users with sensitive files on their endpoints |
| Total Files Scanned | 3.2M · 509.7 GB | Scanned file count and size |
| Files with Sensitive Data | 1.8M · 147.7 GB | Files containing classified sensitive data |
Compare the proportion of users with sensitive data and the proportion of scanned files classified as sensitive.
3. Review Users and Endpoints
Review Top Users with Sensitive Data in the dashboard overview.
| Column | What it shows |
|---|---|
| User | Associated user account |
| Department | User's department |
| User Risk Profile | Risk profile calculated in ZIA |
| Endpoint Name | Associated endpoint and platform |
| Sensitive Files Discovered | Number of sensitive files discovered |
User Risk Profile is calculated in ZIA, not from the sensitive-file count shown here. Review it alongside the endpoint data findings.
Explore the Department, User Group, and Sensitive Data selectors to compare results.
4. Review Data Classifications
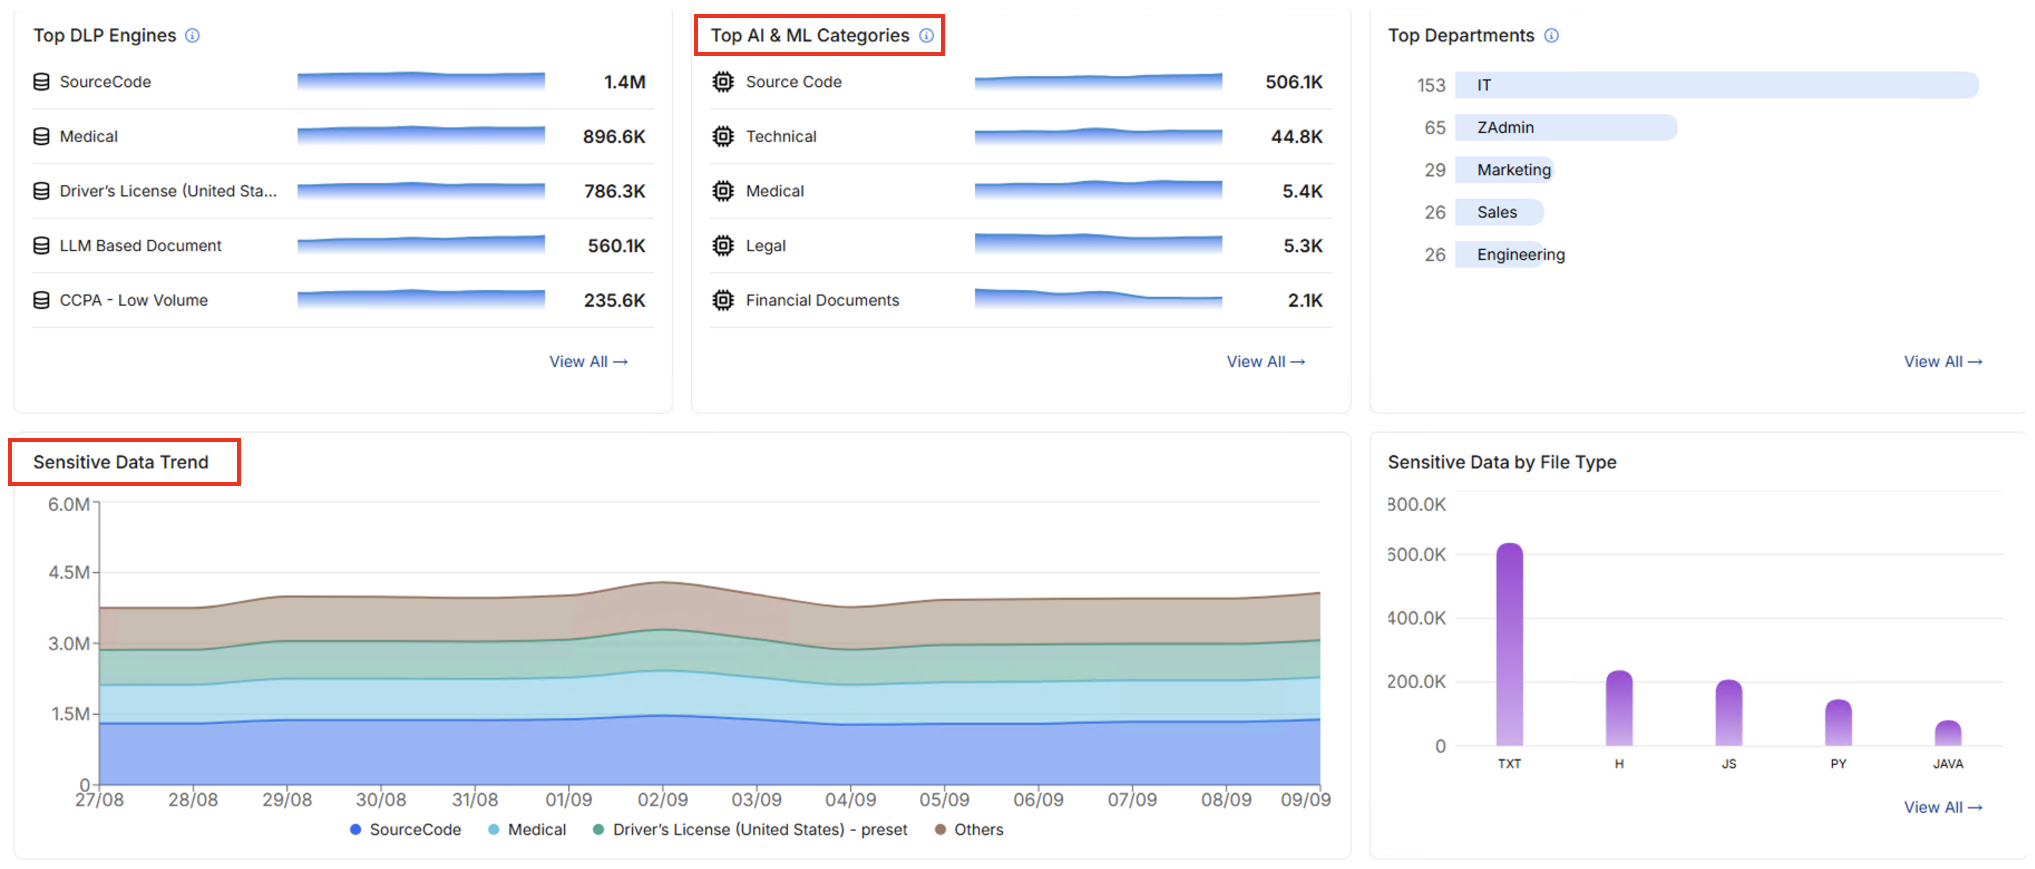
Step 5 — Explore the Classification Widgets
Scroll down to the classification widgets.
| Widget | What to review |
|---|---|
| Top DLP Engines | Leading engine matches, such as SourceCode, Medical, and Driver's License |
| Top AI & ML Categories | Content categories such as Source Code, Technical, and Financial Documents |
| Top Departments | Department breakdown |
| Sensitive Data Trend | Changes over the reporting window |
| Sensitive Data by File Type | File extensions associated with sensitive data |
Use View All where available. Compare classifications, departments, and file types; a file can match more than one classification.
5. Review the Sensitive File Range Distribution
Review Sensitive File Range Distribution in the dashboard overview. The example groups users into:
- More than 100 files
- 25 – 100 files
- Less than 25 files
Check whether sensitive data is concentrated among a few users or spread across the user population.
6. Investigate a User's Endpoint Data
Step 6 — Open User Investigation
Select User Investigation using the people icon in the left navigation. Use the User filter to locate 2305990-sales@thezerotrustlab.com and open the user. You can also sort by Incidents to explore other users.
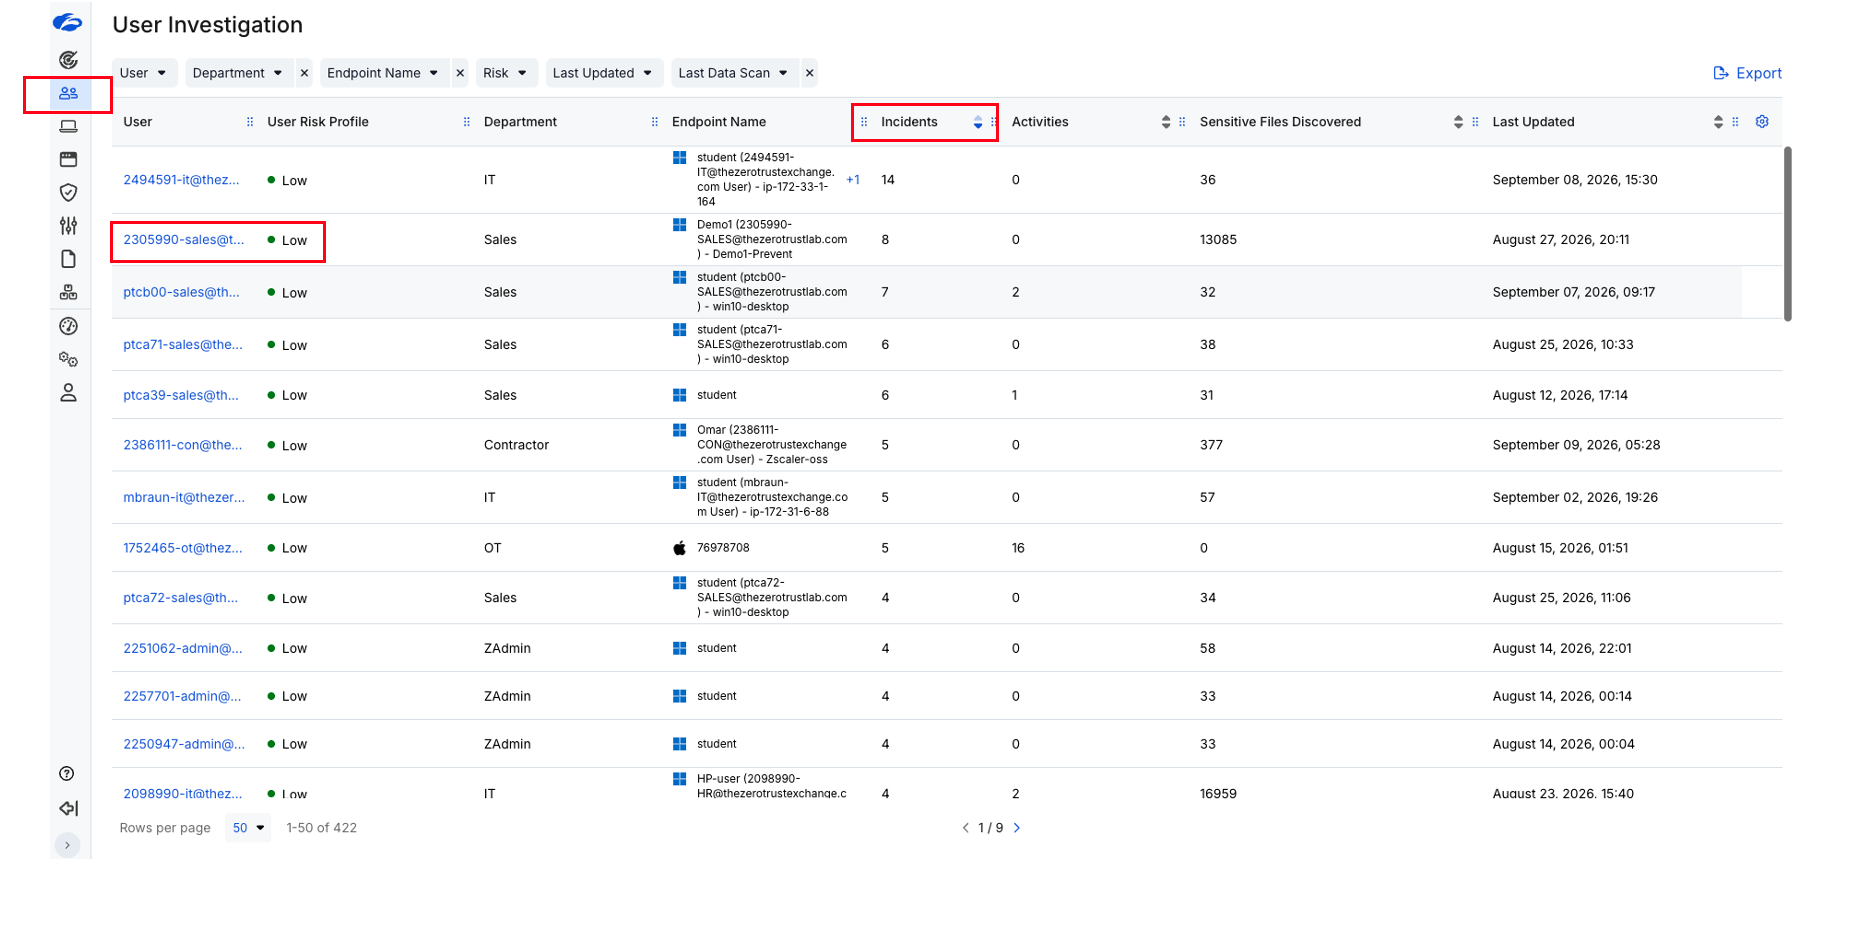
Exact incident numbers and types of incidents may vary in your tenant. Dates, file counts, and other dashboard values may also differ from the screenshots. Use the available records to explore the same fields and views.
Step 7 — Review the User Overview
Confirm the selected user is 2305990-sales@thezerotrustlab.com, then review Overview.
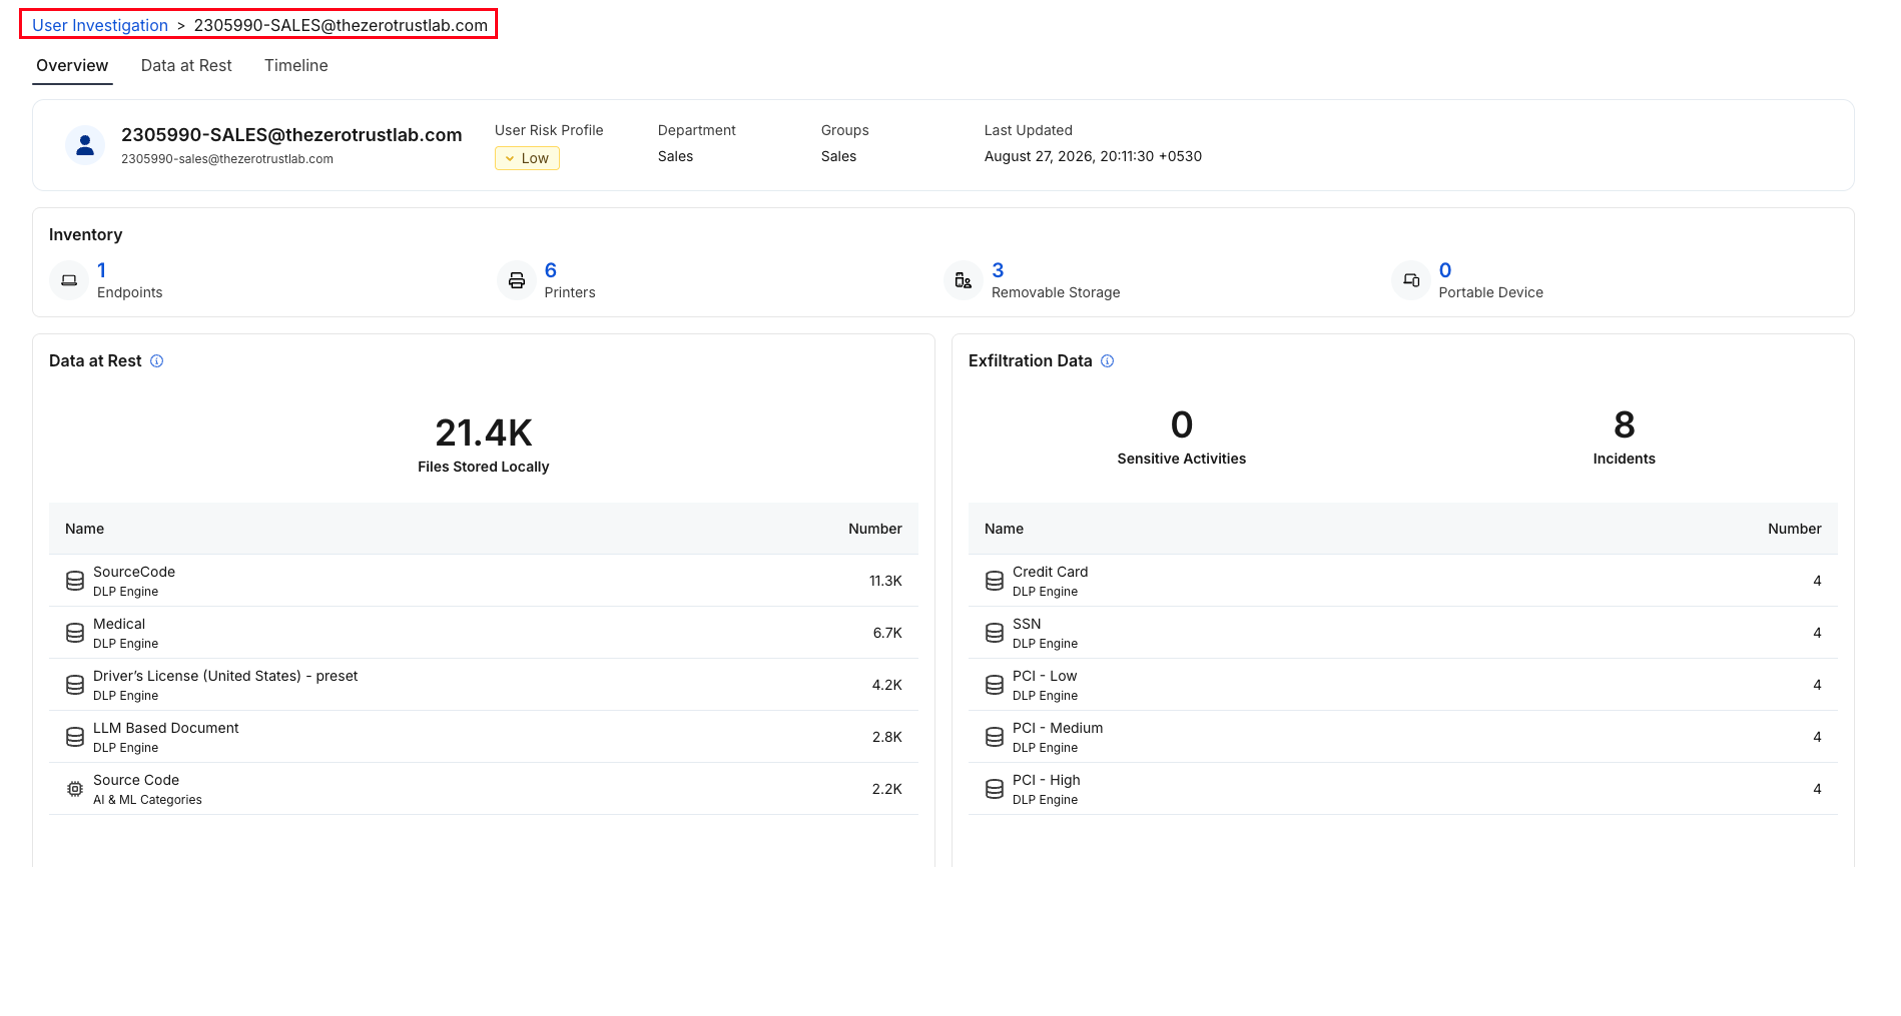
| Area | What to review |
|---|---|
| User details | Department, group, ZIA-calculated risk profile, and last-updated time |
| Inventory | Endpoints, printers, removable storage, and portable devices |
| Data at Rest | Locally stored files and their classifications |
| Exfiltration Data | Sensitive activities, incidents, and associated DLP engines |
Step 8 — Inspect Data at Rest
Open Data at Rest to review scan results and individual files.
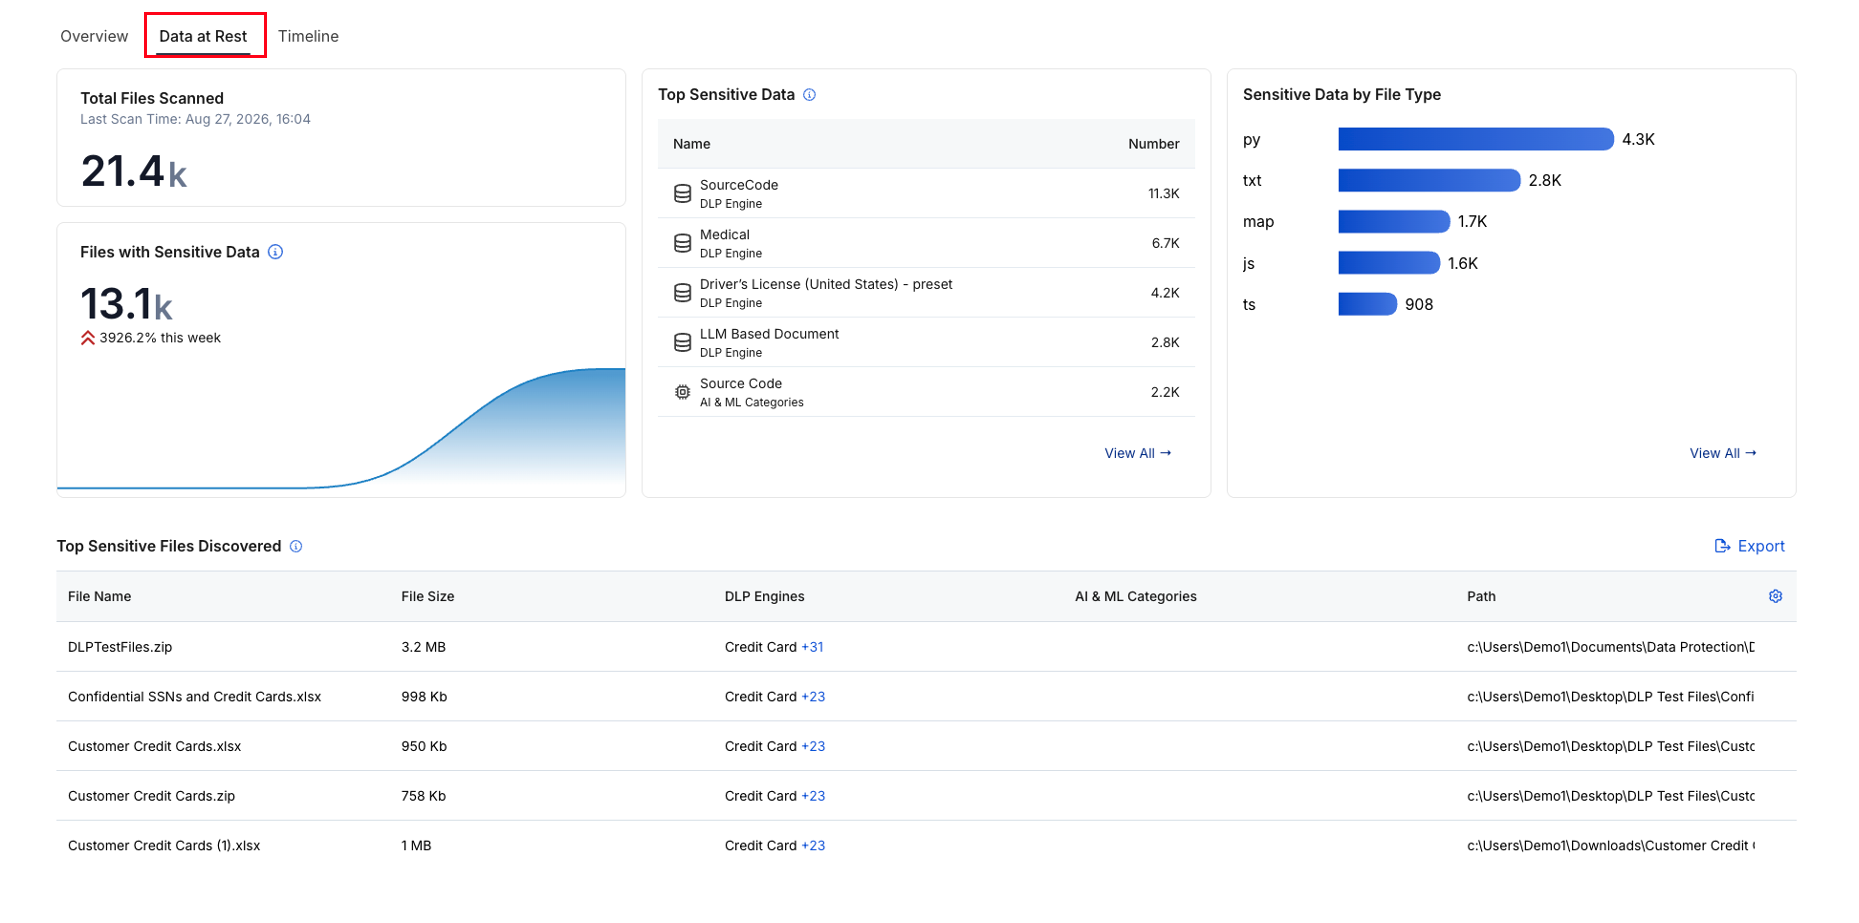
Review Total Files Scanned, Last Scan Time, Files with Sensitive Data, Top Sensitive Data, and Sensitive Data by File Type.
In Top Sensitive Files Discovered, locate Customer Credit Cards.xlsx if present, or choose another file. Review its File Size, DLP Engines, AI & ML Categories, and Path. Explore View All and additional classification matches where available.
Step 9 — Review the User Timeline
Open Timeline and select an incident. The screenshot uses PCI High Print Block from August 27, 2026 at 20:11; if it is not available, select another incident and review the same fields. Incident numbers and types may vary.
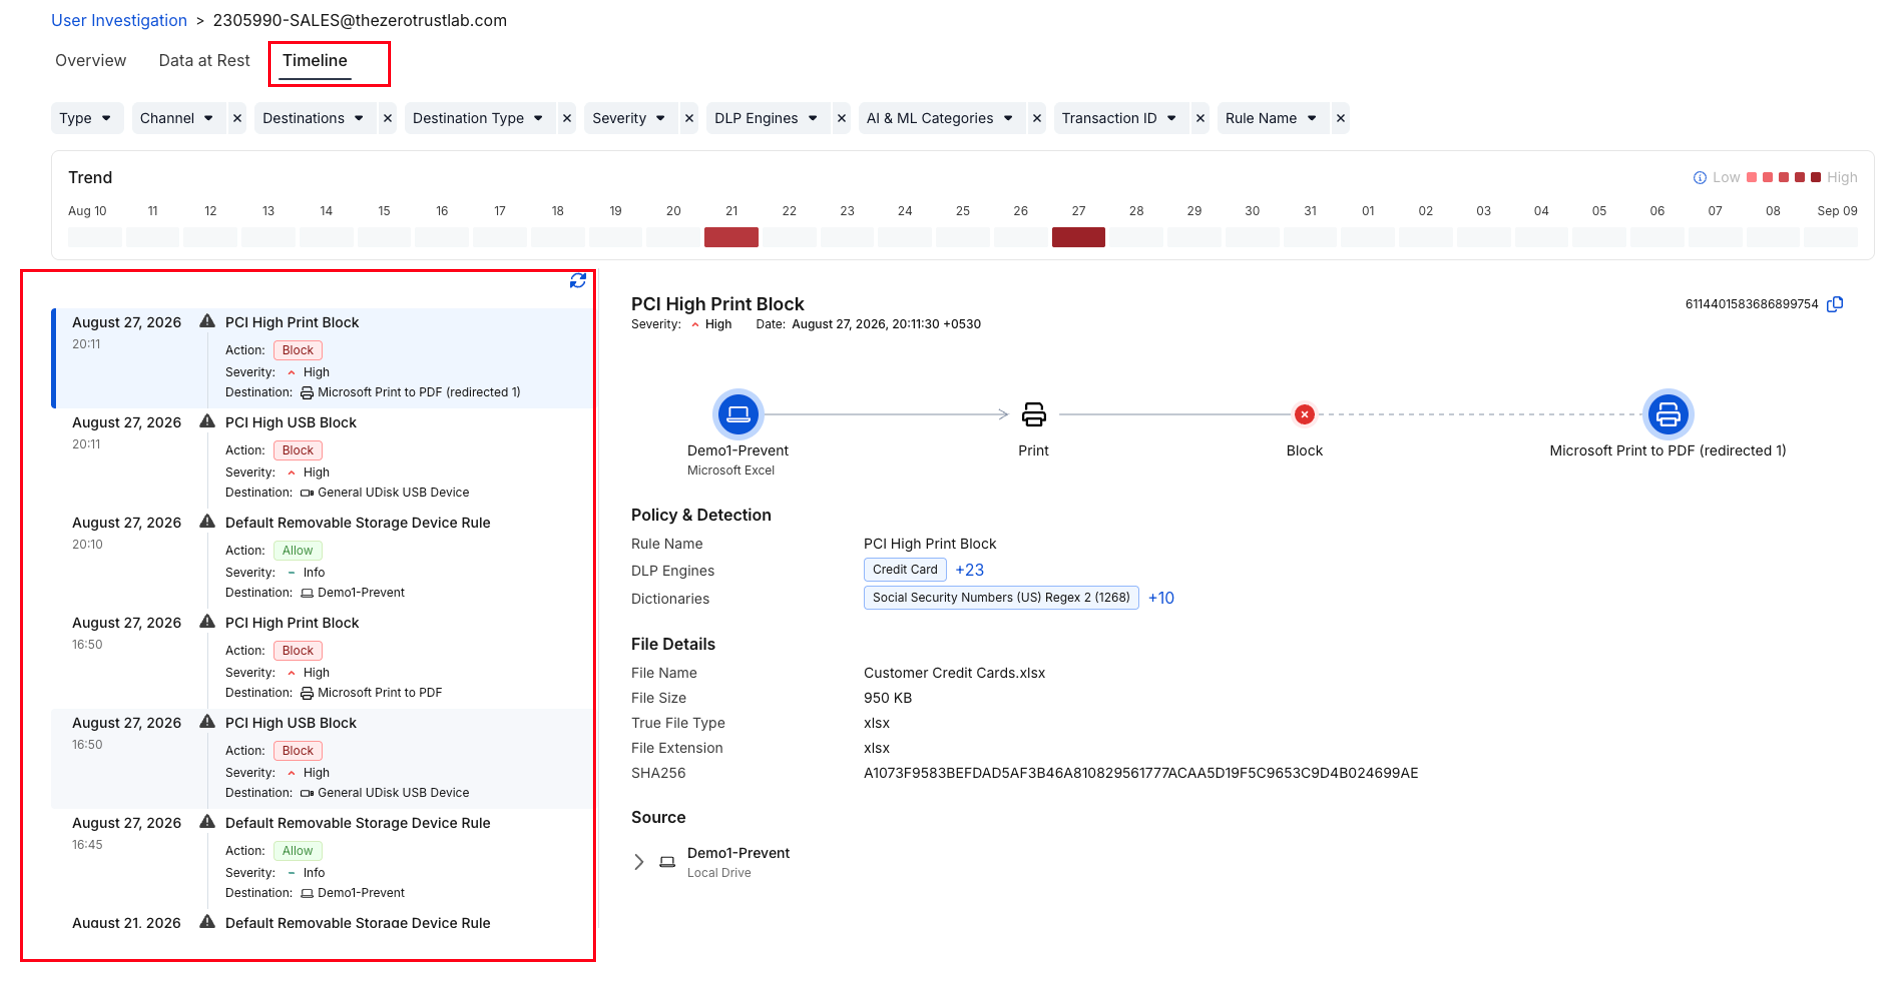
| Detail | What to review |
|---|---|
| Action and severity | Recorded outcome and severity |
| Endpoint and application | Source endpoint and application |
| Channel and destination | How and where the action was attempted |
| Policy & Detection | Rule, DLP engines, and dictionary matches |
| File Details | Filename, size, type, extension, and hash |
| Source | Source device and location |
Compare other events and use the available Timeline filters. A Block action records a prevented attempt; an Allow device event does not establish that a sensitive-file transfer succeeded.
7. Explore Endpoint Applications and Connected Devices
Step 10 — Explore Application Investigation
Select Application Investigation in the left navigation and open Overview.
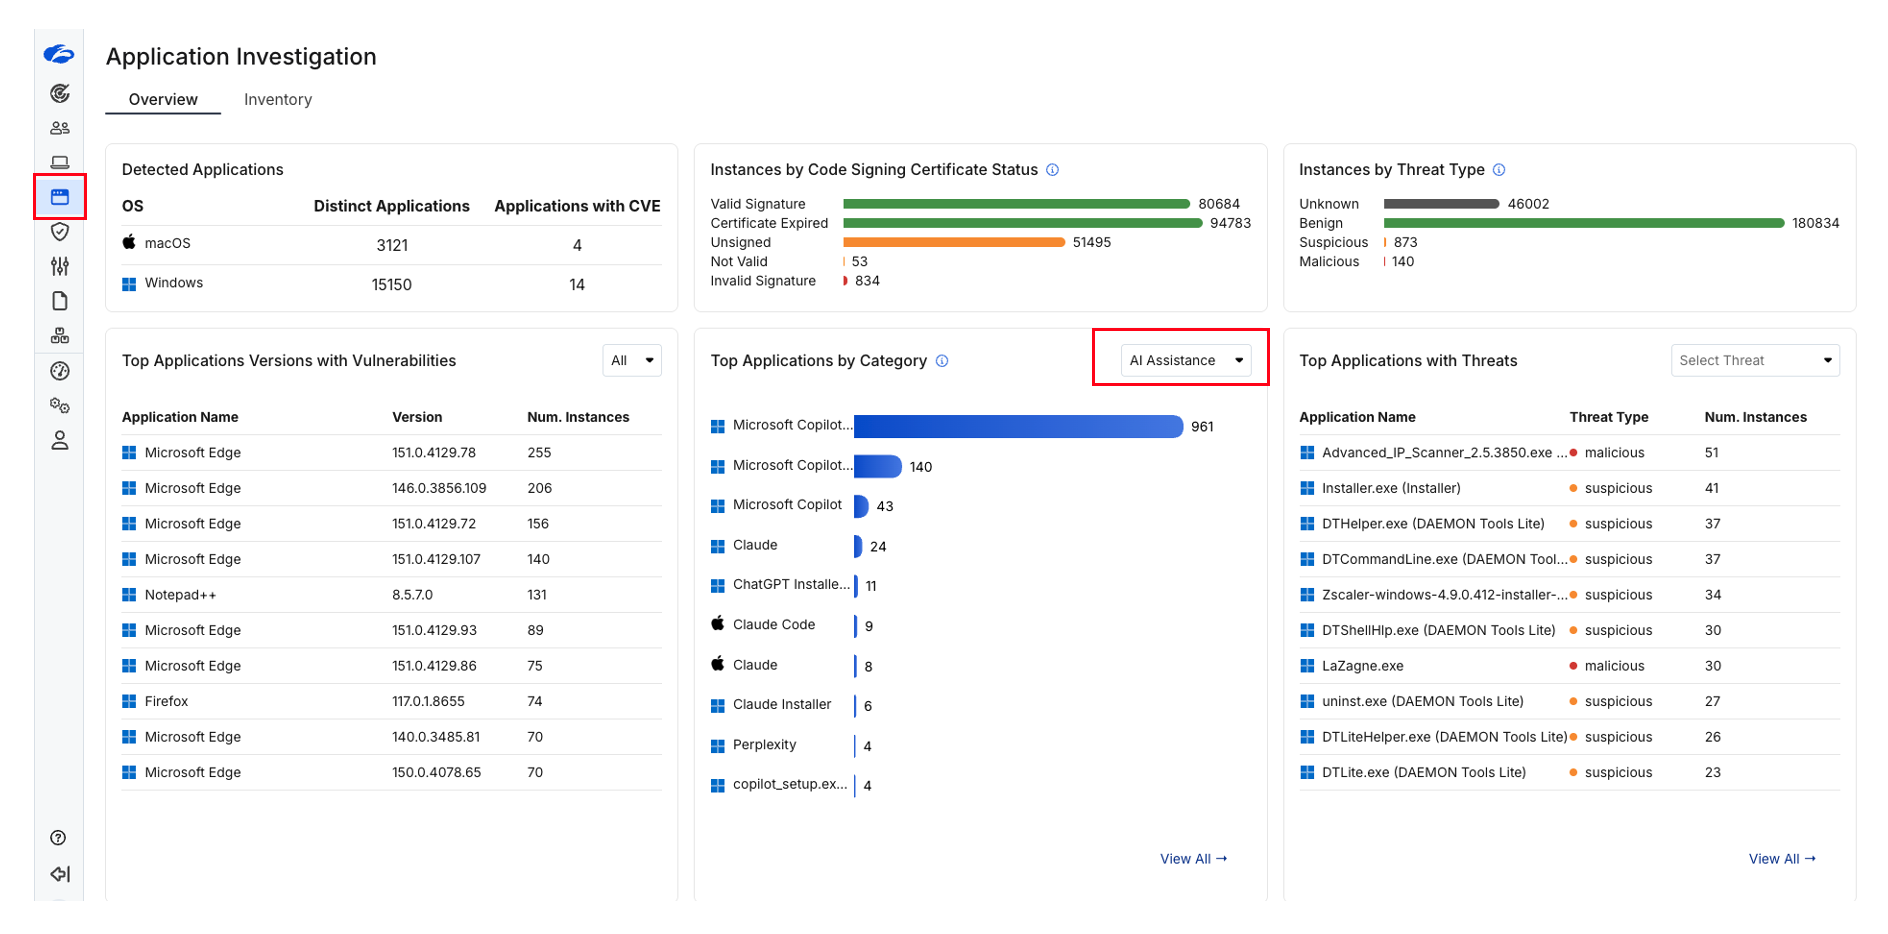
| Widget | What to explore |
|---|---|
| Detected Applications | Applications and applications with CVEs across macOS and Windows |
| Instances by Code Signing Certificate Status | Signature and certificate status |
| Instances by Threat Type | Reported threat classifications |
| Top Applications Versions with Vulnerabilities | Application versions and instance counts |
| Top Applications by Category | Select AI Assistance, then try other categories |
| Top Applications with Threats | Use Select Threat and View All |
Open the Inventory tab and explore available application details. Compare categories and versions rather than stopping at the screenshot example.
Step 11 — Explore Connected-Device Inventory
Select Inventory in the left navigation, then Removable Storage.
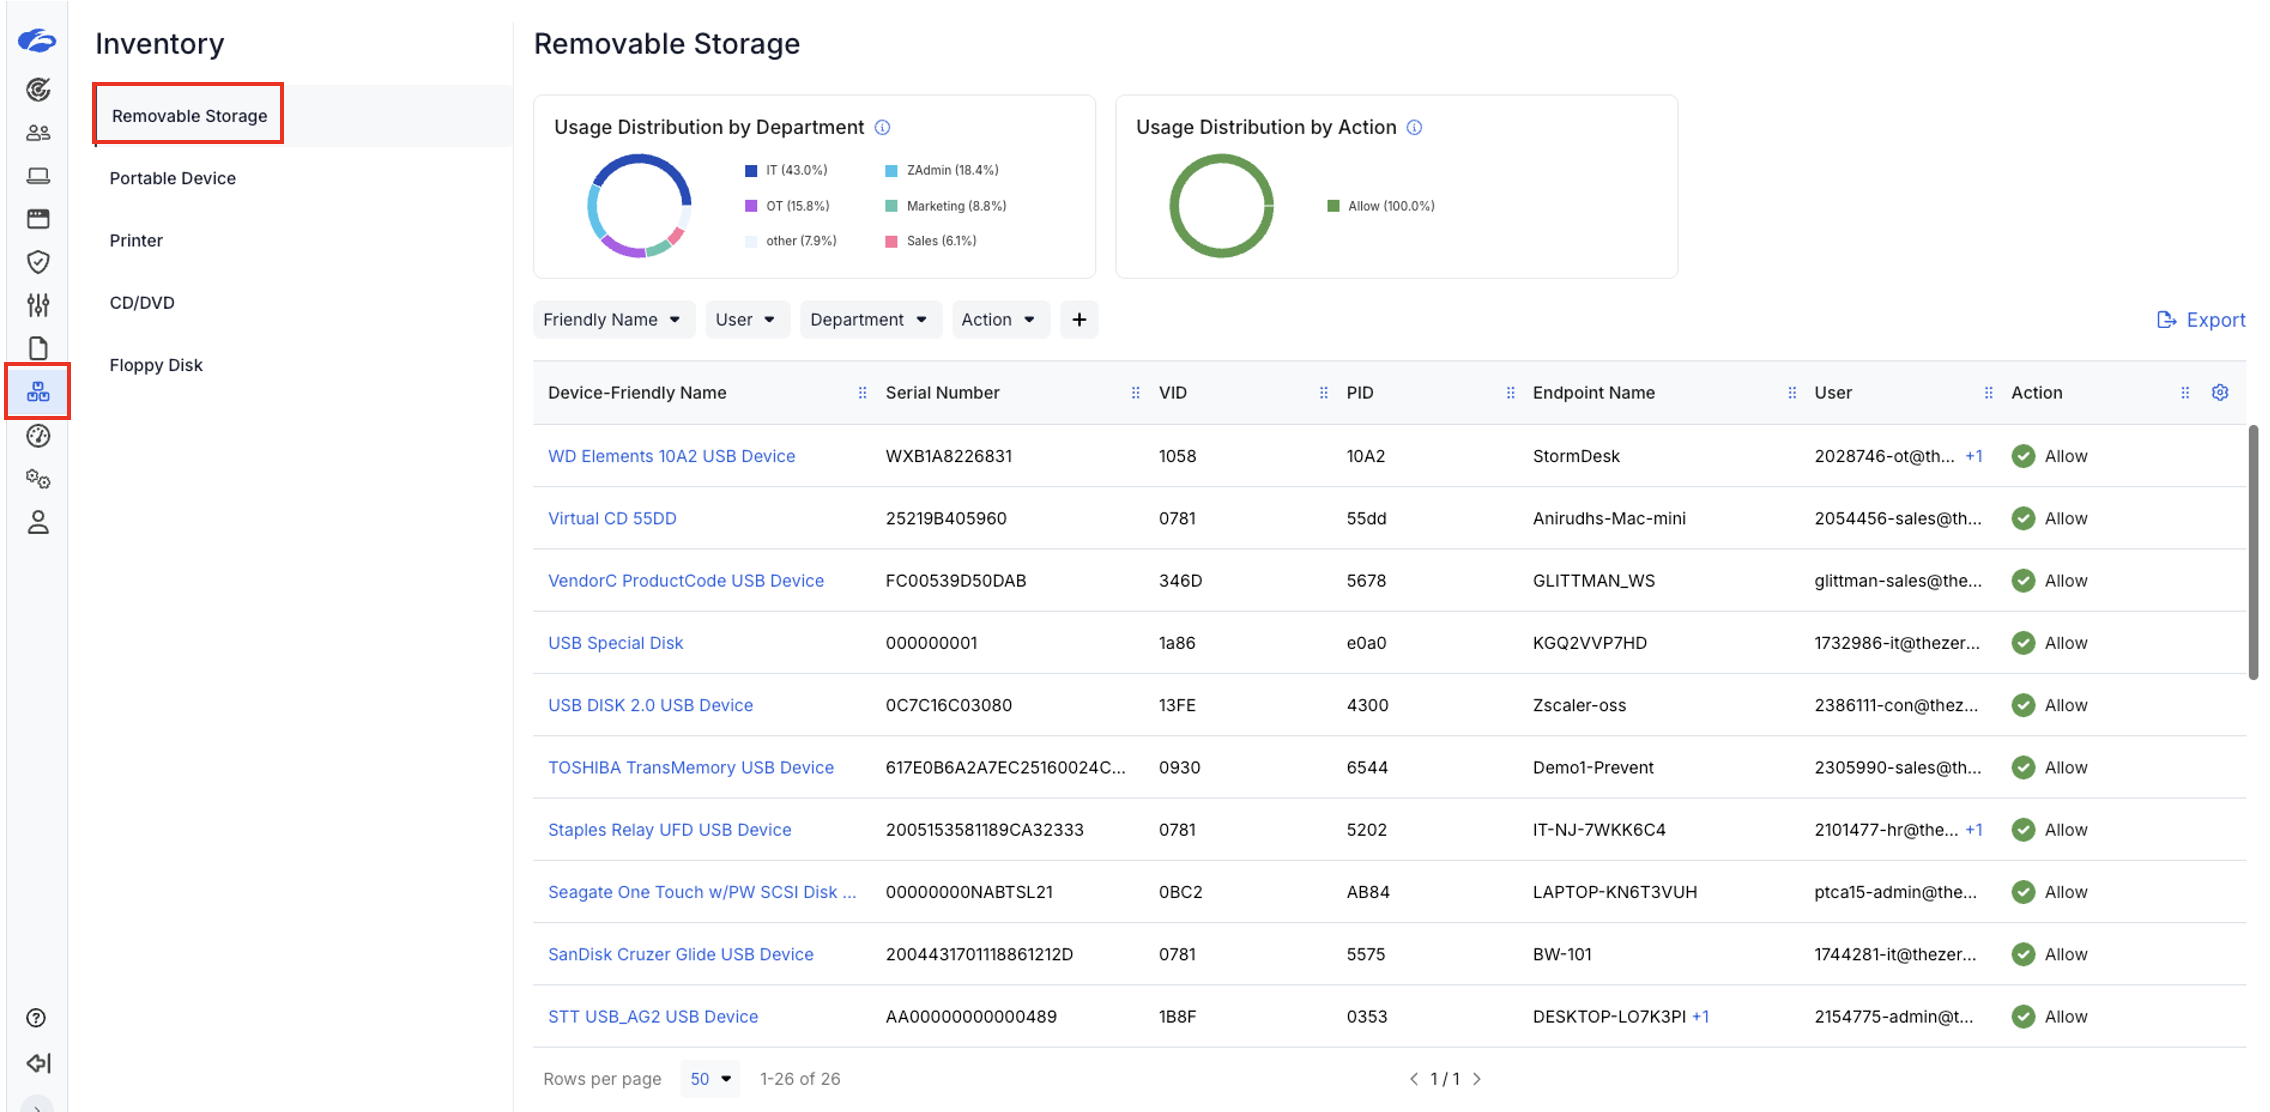
Review Usage Distribution by Department, Usage Distribution by Action, and these device fields:
- Device-Friendly Name, Serial Number, VID, and PID
- Endpoint Name and User
- Action
Use the User filter to explore devices associated with 2305990-sales@thezerotrustlab.com. The screenshot includes a TOSHIBA TransMemory USB Device associated with Demo1-Prevent.
Open linked device names and explore Portable Device, Printer, CD/DVD, and Floppy Disk where available. Inventory shows recorded device associations, not necessarily devices connected right now.
8. Summarise the Complete Endpoint Picture
Questions that you can find answers to:
- How many users and files contain sensitive data?
- Which classifications, departments, and file types appear most often?
- What data and devices are associated with the investigation user?
- What application, channel, destination, rule, and action appear in an incident?
- Which endpoint applications or versions warrant further investigation?
- Which connected-device records can you associate with an endpoint and user?
- What else did you discover through filters, tabs, or drill-downs?
With Endpoint Data Scan and its related views, you gain visibility into sensitive data, endpoint applications, and devices that have been connected. Together with user activity, these views build a complete picture of what is happening on the endpoint.
Keep exploring beyond the steps. Use the available filters, tabs, linked records, and View All options to connect findings across views.
You have completed Lab 3 – Endpoint Data Visibility. Continue to Lab 4 – Microsoft Copilot Readiness.